Download
1 / 69
790 likes | 1.21k Views
Ecology Population Ecology. Populations. A population is a group of individuals of the same species living in an area. 3. Distribution Patterns. Populations disperse in a variety of ways that are influenced by environmental and social factors.

E N D
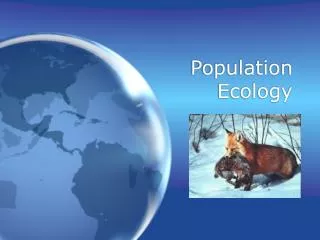
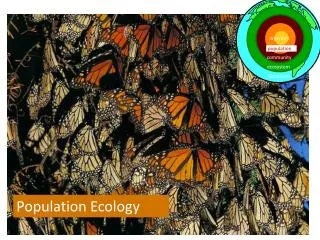
Ecology Population Ecology
Populations A population is a group of individuals of the same species living in an area 3.
Distribution Patterns Populations disperse in a variety of ways that are influenced by environmental and social factors • Uniform distribution results from intense competition or antagonism between individuals. • Random distribution occurs when there is no competition, antagonism, or tendency to aggregate. • Clumpingis the most common distribution because environmental conditions are seldom uniform.
What causes these populations of different organisms to clump together? Clumped distribution in species acts as a mechanism against predation as well as an efficient mechanism to trap or corner prey. It has been shown that larger packs of animals tend to have a greater number of successful kills. Fig. 52.1, Campbell & Reece, 6th ed.
Population Dispersal • Natural range expansions show the influence of dispersal on distribution • For example, cattle egrets arrived in the Americas in the late 1800s and have expanded their distribution
Population Dispersal • In rare cases, long-distance dispersal can lead to adaptive radiation • For example, Hawaiian silverswords are a diverse group descended from an ancestral North American tarweed
The Spread of the Africanized Honey BeeWhen did they first arrive in the Americas? How long did it take for them to expand their range into the US? How can you explain their success in expanding their territory?
Estimating Population SizeThe Mark-and-Recapture Technique 2. 1. 3.
Estimating Population SizeThe Mark-and-Recapture Technique • There’s a simple formula for estimating the total population size s = Number of individuals marked and released in 1st sample x = Number of individuals marked and released in 2nd sample n = Total number of individuals in 2nd sample N = Estimated population size Rearrange to get:
Let’s Try an Example! Twenty individuals are captured at random and marked with a dye or tag and then are released back into the environment. Therefore s = # of animals marked = 20 At a later time a second group of animals is captured at random from the population
Let’s Try an Example! Some will already be marked, say 10 individuals were marked out of 35 that were captured the second time. We now know n=35 and x= 10 So, apply the formula and solve for the estimated population size: = 70 Therefore, N as a population estimate
Which method would you use? 1. To determine the number of deer in the state of Virginia? 2. To determine the number of turkeys in a county? 3. To determine the number of dogs in your neighborhood? 4. To determine the number of ferrel cats in your neighborhood?
1000 Human (type I) Hydra (type II) 100 Survival per thousand Oyster (type III) 10 1 0 25 50 75 100 Percent of maximum life span Survivorship curves What do these graphs indicate regarding species survival rate & strategy? I. High death rate in post-reproductive years II. Constant mortality rate throughout life span III. Very high early mortality but the few survivors then live long (stay reproductive)
Ideal Survivorship Curves I 1,000 100 II Number of survivors (log scale) 10 III 1 0 50 100 Percentage of maximum life span
Population Growth Curves d = delta or change N = population Size t = time B = birth rate D =death rate
Population Growth Models Exponential model (blue) idealized population in an unlimited environment (J-curve); can’t continue indefinitely. r-selected species (r = per capita growth rate) Logistic model (red)considers population density on growth (S-curve), carrying capacity (K): maximum population size that a particular environment can support; K-selected species
Exponential Growth Curves Growth Rate of E. coli d = delta or change N = Population Size t = time rmax =maximum per capita growth rate of population Population Size, N Time (hours)
Logistic Growth Curves • In the logistic population growth model, the per capita rate of increase (rmax) declines as carrying capacity (K) is reached • The logistic model starts with the exponential model and adds an expression that reduces per capita rate of increase as N approaches K
Logistic Growth Curves d = delta or change N = Population Size t = time K =carrying capacity rmax = maximum per capita growth rate of population
Examining Logistic Population Growth Graph the data given as it relates to a logistic curve. Title, label and scale your graph properly.
Examining Logistic Population Growth Hypothetical Example of Logistic Growth Curve K = 1,000 & rmax= 0.05 per Individual per Year
Population Reproductive Strategies • r-selected (opportunistic) • Short maturation & lifespan • Many (small) offspring; usually 1 (early) reproduction; • No parental care • High death rate • K-selected (equilibrial) • Long maturation & lifespan • Few (large) offspring; usually several (late) reproductions • Extensive parental care • Low death rate
How Well Do These Organisms Fit the Logistic Growth Model? Some populations overshoot K before settling down to a relatively stable density Some populations fluctuate greatly and make it difficult to define K
Lemmings DO NOT Commit Suicide! Where the Lemming Suicide Myth Started In 1958 Disney released a nature documentary called White Wilderness in which they filmed a fake migration sequence with imported collared lemmings. They placed lemmings on a spinning turntable, which was filmed from different angles. They then herded the lemmings off a small cliff and into a river. This would make for a more interesting movie but we know now that lemmings don’t commit suicide, they simply migrate and have large fluctuations in their population. Read more at Suite101: What is a Lemming and Do They Commit Suicide?: Do These Small Rodents Follow Each Other Over Cliffs to Their Death? | Suite101.com | http://suite101.com/article/what-is-a-lemming-and-do-they-commit-suicide-a139086#ixzz24flyifOr
Age Structure Diagrams: Always Examine The Base Before Making Predictions About The Future Of The Population Rapid growth Afghanistan Slow growth United States No growth Italy Male Female Male Female Male Female Age 85+ 80–84 75–79 70–74 65–69 60–64 55–59 50–54 45–49 40–44 35–39 30–34 25–29 20–24 15–19 10–14 5–9 0–4 Age 85+ 80–84 75–79 70–74 65–69 60–64 55–59 50–54 45–49 40–44 35–39 30–34 25–29 20–24 15–19 10–14 5–9 0–4 10 8 6 4 2 0 2 4 6 8 10 8 6 4 2 0 2 4 6 8 8 6 4 2 0 2 4 6 8 Percent of population Percent of population Percent of population
Predicting Populations Sex and the Single Guppy
Natural Selection • This includes describing how organisms respond to the environment and how organisms are distributed. • Events that occur in the framework of ecological time (minutes, months, years) translate into effects over the longer scale of evolutionary time (decades, centuries, millennia, and longer).
Modes of Selection http://gregladen.com/blog/2007/01/the-modes-of-natural-selection/
Modes of Selection Disruptive- produces a bi-modal curve as the extreme traits are favored Stabilizing-reduces variance over time as the traits move closer to the mean Directional-favors a phenotypic trait (selected by the environment)
Scenario These photographs show the same location on Captiva Island following Hurricane Charley. What would happen to a population of birds who derive their diets from the tree tops? The population had a wide range of beak sizes. What would happen to the population gene pool over time if the new environment favored smaller beaks? Over time, which beak would be most represented in the population of birds?
Selection Diagrams A B C
Species absent because Yes Yes Dispersallimitsdistribution? Yes No No No Biogeography & Distribution of Species • Serves as a starting point to understanding limits on distribution of species
Species absent because Area inaccessible or insufficient time Yes Yes Dispersallimitsdistribution? Yes Behaviorlimitsdistribution? No No No Biogeography & Distribution of Species • Serves as a starting point to understanding limits on distribution of species
Species absent because Area inaccessible or insufficient time Yes Yes Dispersallimitsdistribution? Habitat selection Yes Behaviorlimitsdistribution? Biotic factors(other species)limitdistribution? No No No Biogeography & Distribution of Species • Serves as a starting point to understanding limits on distribution of species
Species absent because Area inaccessible or insufficient time Yes Yes Dispersallimitsdistribution? Habitat selection Yes Predation, parasitism,competition, disease Behaviorlimitsdistribution? Biotic factors(other species)limitdistribution? No No Abiotic factorslimitdistribution? No Biogeography & Distribution of Species • Serves as a starting point to understanding limits on distribution of species
Species absent because Area inaccessible or insufficient time Yes Yes Dispersallimitsdistribution? Habitat selection Yes Predation, parasitism,competition, disease Chemical factors Behaviorlimitsdistribution? Biotic factors(other species)limitdistribution? No WaterOxygen Salinity pHSoil nutrients, etc. No Abiotic factorslimitdistribution? No TemperatureLight Soil structure FireMoisture, etc. Physical factors Biogeography & Distribution of Species • Serves as a starting point to understanding limits on distribution of species
Hydrangea Flower Color Hydrangea react to the environment and ultimately display their phenotype based on the pH of their soil. Hydrangea flower color is affected by light and soil pH. Soil pH exerts the main influence on which color a hydrangea plant will display.
Fish And Maintaining Homeostasis In Various Water Conditions Fish and other aquatic animals deal with changing environments in part due to nature and in part due to human interactions. Pressure- their bladder fills with gas to equalize internal pressure