Download
1 / 24
250 likes | 436 Views
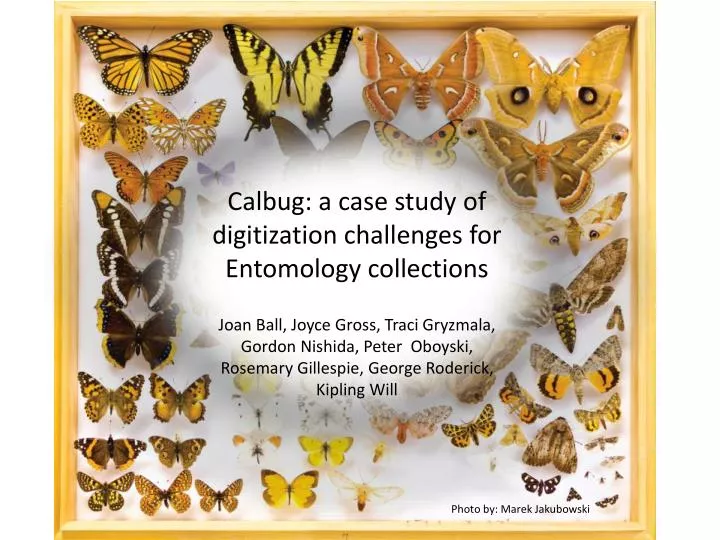
Calbug : a case study of digitization challenges for Entomology collections Joan Ball, Joyce Gross, Traci Gryzmala , Gordon Nishida, Peter Oboyski , Rosemary Gillespie, George Roderick, Kipling Will. Photo by: Marek Jakubowski. Background Workflow & Challenges Progress Future Direction.

E N D
Calbug: a case study of digitization challenges for Entomology collections Joan Ball, Joyce Gross, Traci Gryzmala, Gordon Nishida, Peter Oboyski, Rosemary Gillespie, George Roderick, Kipling Will Photo by: Marek Jakubowski
Background Workflow & Challenges Progress Future Direction Photo by: Marek Jakubowski
What is CalBug? Essig Museum of Entomology California Academy of Sciences California State Collection of Arthropods Bohart Museum, UC Davis Entomology Research Museum, UC Riverside San Diego Natural History Museum LA County Museum Santa Barbara Museum of Natural History
Goals 1.) Digitize and geo-reference 1.2 Million specimens from eight California institutions spanning 110 years of specimen collecting 2.) Analyze spatial and temporal changes in distributions due to land use change, invasive species, habitat fragmentation, and climate change Photo by: Marek Jakubowski
Stratified data capture: All specimens of species found in field stations Images and Field Notes Species Checklists Historical Climate Records Digital Data: Climate Sensor Networks UC Natural Reserve System
Background Workflow & Challenges Progress Future Direction Photo by: Marek Jakubowski
Workflow 5a. Manually enter data into MySQL database with some error checking 1. Select taxa for databasing 6. Error Checking 2. Sort specimens by location & date 7. Georeference locality 5b. Online crowd-sourcing of manual data entry 3. Arrange labels to view all text, add catalog # label 8. Upload data to cache 5c. Optical Character Recognition & data parsing 9. Temporospatial analyses 4. Take, name, and save digital image of labels
Imaging Workflow Challenges: Labels are small and stacked beneath specimen Specimen handling is inefficient, process extremely time consuming Current Imaging Rate: 60 specimens per hour per person 1. Select taxa for databasing 2. Sort specimens by location & date 2. Sort specimens by location & date 3. Arrange labels to view all text, add catalog # label 3. Arrange labels to view all text, add catalog # label 4. Take, name, and save digital image of labels 4. Take, name, and save digital image of labels
Data Entry Workflow • Crowd Sourcing: • - Interactive website • Volunteers enter data 3X • Evaluate multiple entries for consistency • Museum staff – focus on imaging, QAQC, public relations • Develop dictionaries of common abbreviations and California localities- pick lists and controlled fields to reduce error… 5a. Manually enter data into MySQL database with some error checking 5b. Online crowd-sourcing of manual data entry 5c. Optical Character Recognition & data parsing OCR “Smart” parsing program– assign data elements to database fields based on context and dictionary terms 5a. Manually enter data into MySQL database with some error checking 5b. Online crowd-sourcing of manual data entry 5c. Optical Character Recognition & data parsing
Data quality, access & analysis Workflow 6. Error Checking Georeferencing & Mapping: Biogeomancer Estimate coordinates and error radius based on standardized protocols Error Checking: Sort by locality and date to identify typographic errors, and by record number to find carry-over errors. Compare 10 % of records with label images. • Example: Analyzing data • Dragonfly specimens throughout CA over 100 years • Combine with: observation data, 1914 survey, current field studies • Changes in biodiversity, species composition, and distribution • Metrics of climate and land use change 6. Error Checking 7. Georeference locality 7. Georeference locality Data Cache 8. Upload data to cache 8. Upload data to cache 9. Temporospatial analyses 9. Temporospatial analyses Source: Cal-Adapt and the Public Interest Energy Research program, California Energy Commission • Analyzing data for global change • Annual average high temperatures under a high emissions scenario of climate change • Records of arthropod collections over the past 100 years • Predict the impact of climate change on arthropod distributions.
Publicly available data layers Land Cover Temperature (max, min, mean) Past, Present, Projected Future Species Distributions Past, Present, Projected Future Topography Soils Precipitation Past, Present, Projected Future Land Use Private, Public, and Protected Hydrology
Ongoing Research Projects • In support of taxonomy and undergraduate research
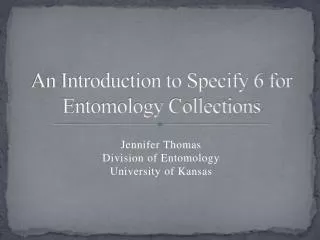
~23,000 georeferenced specimens in the EMEC database from the Californian Floristic province. #specimens Years
~23,000 georeferenced specimens in the EMEC database from the Californian Floristic province. J. Powell Post war resurgence reconfiguration #specimens WW2 Initial development Years
Background Our Database Workflow & Challenges Progress & Future Direction Photo by: Marek Jakubowski
Progress Made – Essig museum Data Entered: EMEC total 122,000 -42,000 since 1, Sept 2010 -55,289 CA specimens -65,000 georeferenced Images Taken: 44,200 images
Progress Made – Collaborators CDFA: 14,000 Sphecidae, pests Bohart: 25,000 Sphecidae SBMNH: 140,000 Coleoptera (museum records and literature) Riverside: 26,500 bees CAS: 15,000 Neuroptera Photo from CA Beetle Project site Photo by: Texas A&M University Photo by: Robin Coville
Timeline Analysis of data: Arthropod response to global change Year 2: Image and Digitize 320,000 Specimens; QAQC Year 4: Image and Digitize 320,000 Specimens; QAQC Start of Calbug Finish Year 3: Image and Digitize 320,000 Specimens; QAQC Year 1: 240,000 Specimens Digitized Year 5: Georeferencing Imaging Goal – Next 3 years: 320,000 images per year 6,500 images per week (48 weeks)
Future Directions – Simplify and disperse the workflow Remove sorting step (2), and museum staff data entry (5a) Speed up image capture through assembly line process (4) • Set up stations for specific handling tasks • Automate file naming and saving Develop dictionaries of localities, and common abbreviations to reduce error and speed data entry 6. Error Checking 1. Select taxa for databasing 5b. Online crowd-sourcing of manual data entry 7. Georeference locality 3. Arrange labels to view all text, add catalog # label 8. Upload data to cache 5c. Optical Character Recognition & data parsing 4 (Modified). Run sheets of specimens through imaging station 9. Temporospatial analyses
Looking ahead • Data from many millions of additional specimens will remain to be captured • “brute force” entry needs to be coupled with any technological advances that we can harness • Intermediate products are necessary
Acknowledgements All participating organizations National Science Foundation John Weiczorek, Michelle Koo, Carol Spencer Berkeley Natural History Museums Consortium Biodiversity Sciences Technology (BSCIT) Citizen Science Alliance >20 Undergraduates


![Digitization Challenges for [Jewish] Genealogy](https://cdn2.slideserve.com/4397566/digitization-challenges-for-jewish-genealogy-dt.jpg)