Download
1 / 36
670 likes | 2.29k Views
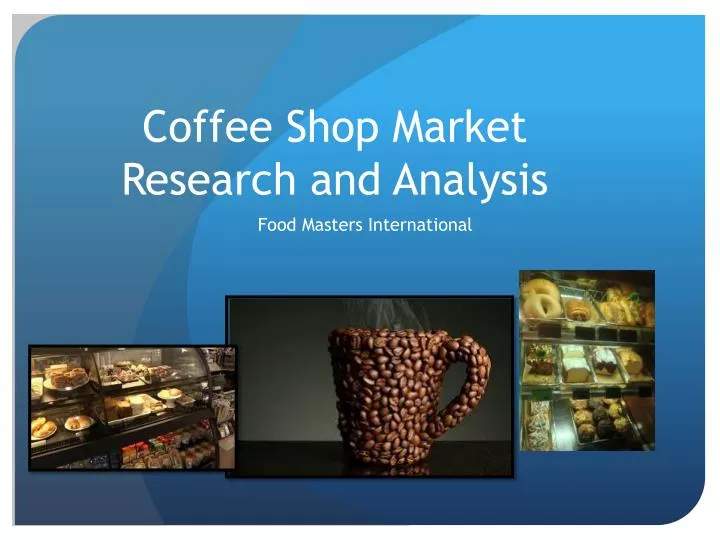
Coffee Shop Market Research and Analysis. Food Masters International. Top 10 Coffee Shop Companies in the United States. Starbucks Caribou Coffee Tim Horton’s Coffee Bean & Tea Leaf Coffee Beanery Seattle’s Best Peet’s Coffee Tully’s Dunn Bros. Coffee Port City Java.

E N D
Coffee Shop Market Research and Analysis Food Masters International
Top 10 Coffee Shop Companies in the United States • Starbucks • Caribou Coffee • Tim Horton’s • Coffee Bean & Tea Leaf • Coffee Beanery • Seattle’s Best • Peet’s Coffee • Tully’s • Dunn Bros. Coffee • Port City Java
U.S. Market Statistics & Information • Currently about 20,000 coffee shop businesses in the U.S., combined revenues of $10 billion in 2011 • 70% of sales derives from the primary top 50 coffee shop operators such as Starbucks, Caribous, and Peet’s Coffee; with small local family owned coffee shops in competition • Gross Margin for a coffee shop is about 85%, operating income averaging 2.5% of net sales
U.S. Market Statistics & Information • Important to have friendly, high energy teams of employees due to the required labor intensive nature of coffee brewing; annual revenue per worker generates about $50,000 • 65% coffee consumption takes place during breakfast hours • Average number of cups of coffee (9 ounces) a coffee drinker consumes daily is 3.1 • Average percentage of people who go to premium places like Starbucks or Coffee bean when they go out is 34%
U.S. Market Statistics & Information • Total percentage of coffee consumed between meals is 30% • 60% people claim that they need coffee to start their day • 54% people claim that their morning coffee makes them feel more like their self • 68% people consume their morning coffee within the first hour of getting up in the morning • Total amount of yearly money spent on specialty coffee in the U.S. is 18 billion
Popular Products Consumed with Coffee • The favored pastry product with coffee depends on region, and demographics • Most popular include… • Coffee Cake– northeastern region of United States • Muffins– most popular type being blueberry with bran, apple, and banana as second; people really enjoy the texture and flavor with the hot coffee; considered dense, sweet breads • Donuts or Doughnuts– small ring shaped cakes, light, sweet dough fried in oil; most popular types are plain, glazed, jelly filled, French donuts and crullers
Popular Products Consumed with Coffee, Continued… • Shortbread – buttery, crumbly texture and is a natural foil for coffee’s rich flavor; shortbread cookies are ideal for dunking purposes as the bread absorbs the coffee without breaking off • Danish Pastry – coffee & Danish pastries are the most common components of a regular Continental breakfast; buttery and rich, yeast-raised egg dough base with fruit or cheese filling, drizzled with sugar icing glaze • Italian Pastry – vary widely from cannolis to rum cake, all go well with all kinds of coffee
Popular Products Consumed with Coffee, Continued… • Chocolate Cake – (coffee is popular after dinner as well) sweetness of chocolate pairs well with coffee; devil’s food cake, fudge cake, or chocolate cream pie are some of the most popular dessert choices around the country • Biscotti – (originally the Italian word for cookies) made with sweet dough cooked till it is dry and hard; perfect for dunking due to texture and traditional rounded wedge shape
Consumer Statistics & Preferences of 2012 • Information provided by National Coffee Association, National Coffee Drinking Study • 40% of 18-24 year olds drink coffee daily (up from 31% in 2010) • Why? 29% People felt better about their financial situation… • No other group shared the financial concern • 54% of adults age 25-39 drink coffee daily (up from 44% in 2010) • Overall, 46% of total surveyed coffee drinkers said that they felt that their financial situation to be the same as the past
Consumer Statistics & Preferences of 2012 • Generally, over 75% of U.S. adults drink coffee, and 58% drink coffee daily • Coffee drinkers still outnumber tea drinkers…183 million coffee drinkers to 173.5 million • 2012, combined sales of coffee and tea at restaurant and beverage places is estimated to total $18.7 billion • Strong increase in demand for specialty coffees (ex. Cappuccinos, lattes, Americanos and Macchiatos having highest popularity)
Consumer Statistics & Preferences of 2012 • Most adult coffee drinkers believe their coffee consumption habits initiated during their teenage years • 54% said they began drinking coffee between 13 and 19 years old • 22% believe their coffee fondness began between the ages of 20 and 24 • Marketing to young age groups is important, but a focus on older age groups would be more profitable as they are the customers with the larger purchasing power
Consumer Statistics & Preferences of 2012 • Coffee shop owners say that they usually find regular (weekly or more) customers in the younger age groups, particularly high school and college students, as well as newly employed and/or first job • Parents also very important demographic to market to, especially ones with older children where they would have more time to go out for coffee rather than stay at home with young children • The feelings associated with coffee are generally comforting and warm, thus it is logical that a customer will be more inclined to purchase a comforting food item such as pastry or baked goods.
Product Trends of 2012 • Of general hot beverage sales, coffee is the highest (83.3%) • U.S. coffee consumption is expected to increase through 2015, average annual rate of 2.7%, and tea consumption to increase with average annual rate of 3.1% • Most likely causes for positive expectations of growth are due to increasing innovations in premium gourmet coffee products (ex. Pods, single serving instants, etc.) • Instant serving packs have increased in popularity, 2% surveyed said they use them regularly as 10% say they buy them infrequently
Product Trendsof 2012 • General price of coffee has increase by about 25% since 2007, largely due to the greater burden of commodity price increases being passed onto the consumers, but this trends is slowing • According to Starbucks, their retail sales breaks down as follows… • Beverages 75% • Food 19% • Whole bean and soluble coffees 4% • Coffee making equipment and other merchandise 2%
Product Trends of 2012 • Blondies are becoming a popular replacement of the Brownie • Blondie – generally are paler brownies • Additions such as peanut butter, toffee, etc. help make this item stand apart from the average brownie in addition to the refreshing color of the baked good • Breads with more whole grains, and have the physical appearance of being less processed create the image that the product holds more healthier value than the average bread • Appealing to the growing trend in health foods
Product Trends of 2012 • Greek Yogurt is becoming much more prefer over the average yogurt due higher protein content, is delicious served like a parfait • Appealing to the growing trend in health foods • Dark Chocolate over milk chocolate is perceived to have greater health benefits, therefore can attract the health conscious consumers • Hot Food Options are always a popular item customers purchase, especially during the winter
Product Trends of 2012 • Although declines in disposable income and healthier eating trends due to the recession, spending habits are on the rise and healthier eating trends are dulling down. But the motivation to lose weight is always an attractive sales point to any consumer apart of any demographic
Sales & Marketing Strategies • Most customers are looking for that special something, that creates an edge over competitors, as there are many competitors (thus the profitable coffee at Starbucks, despite the high prices) • Use of technology for marketing and customer attraction help set apart coffee shops, and aid in competing with large chain coffee shops; the goal is to increase visibility in the local market • FourSquare • Yelp • Google Places
Sales & Marketing Strategies • Vital to have well trained baristas, thus investment in staff training and online education services are smart • Customer Loyalty programs that establish more potential for the customer to benefit from their provided business and in return continue buying from that particular coffee shop • Have a good variety of coffee-related products, and put focus on co-marketing opportunities with surrounding institutions such as colleges or other similar places in the area
Sales & Marketing Strategies • Main coffee shop competitors are convenience stores, gas stations, quick service and fast food chains, gourmet food shops, and donut shops • Prime locations such as near corporate business, schools, busy areas is vital to having a heavy traffic of customers as convenience is many times one of the highest priorities… • That said, it is important to carry not only beverages, but a variety of food items since many customers might be buying for their lunch of snack they intent to consume later in the day
Global Bakery & Pastry Industry Statistics & Analysis • Overall global baked goods industry is expected to exceed $310 billion in 2015, according to Global Industry Analysts • Higher demand for baked and pastry goods is perpetuated by changing lifestyles, where people have less time to prepare their own meals and bake • Research shows that busy consumers are much more likely to purchase convenient baked snack food such as pastries, wraps, and sandwiches (they are more focused on their hunger, therefore are more likely to be impulsive regarding their food choices)
Global Bakery & Pastry Industry Statistics & Analysis • Factors related to industry growth include convenience, affordability, and health benefits of the baked products • Baked goods industry primarily includes products like bread, cereals, cakes, biscuits, pastries, and scones; all of which are well established in industrialized regions such as Western Europe and North America
Age & Gender Research, Breakfast Food Preferences • By understanding your different markets that your products need to appeal to, a business is much better equipped to offer products that will meet consumer needs and in return generate more revenue for the business at large • Social Media is an increasingly popular trend among all demographics, primarily with younger individuals; marketing through social media is an essential tool to all businesses with long-term goals and in order to effectively brand the products • Customers are overall looking for convenience, great taste, and value all in one stop
Individual Coffee Company Profile Starbucks, Caribou Coffee, Coffee Bean & Tea Leaf
Starbucks • Social Media & Internet Involvement: Twitter, Facebook, YouTube, My Starbucks Idea • Total Net revenue at end of fiscal 2012, had increased by 14% to $13.3 billion • 16% of Revenue in Food was about $2,092.8 million
Starbucks • Considered 24th of the 50 most innovative companies in the world • They read their consumer preferences well and integrate them into a long-term strategy for growth and profit • They are able to introduce a lot of new and different products quickly, keeping the customers interested and motivating them to come back to try something different • Ex. Seasonal flavors • They have also increased their healthier options • The App they have makes it fun for customers to use their phone to pay, as well as making it easier for them to offer free songs, games, and eBooks through a link to iTunes
Starbucks • Total of 17,651 stores (as of July 1st, 2012), in 60 countries • More than 30 blends and single-origin premium coffees • Sells baked pastries, sandwiches, salads, oatmeal, yogurt parfaits and fruit cups • Brand Portfolio includes: Starbucks Coffee, Seattle’s Best Coffee, Tazo Tea, Evolution Fresh, La Boulange and Torrefazione Italia Coffee • Branding & Responsibilities: Ethical Sourcing, Environmental Stewardship, Community Involvement
Food Products Majority of the products Starbucks and other coffee shops offers are popular and the amount and varieties carried varies from store to stores and market to market.
The Coffee Bean & Tea Leaf • Owned and operated by International Coffee & Tea, LLC • Over 900 locations, 23 countries • About 6,400 employees (since 2010) • Revenue of about $23.1 million (est. in 2010) • Kosher coffee • It is the oldest and largest privately held specialty coffee and tea retailer in the United States • Twitter, Pinterest, Facebook, YouTube • Mostly located in California
Caribou Coffee • 2nd Largest specialty coffee and espresso retailer in the United States, after Starbucks • Almost 500 Company-Owned Locations, as well as 126 franchise locations • Located in 16 States, District of Columbia, several countries apart from the U.S. • $292 Million Revenue in 2009 • Moto: “Life is short. Stay awake for it.” • Partners with Kemp, Keurig, Rainforest Alliance • 6,000+ Employees