Download
1 / 26
310 likes | 657 Views
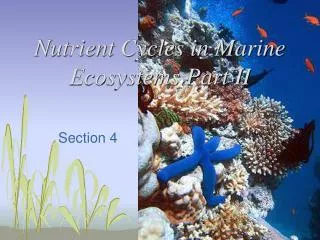
Nutrient Dynamics in Estuarine and Coastal Marine Ecosystems. Daniel Conley 1 , Peter M.J. Herman 2 and Vincent Escaravage 2. 1 Department of Marine Ecology, National Environmental Research Institute, Roskilde, Denmark and Department of Marine Ecology, Institute of Biological

E N D
Nutrient Dynamics in Estuarine and Coastal Marine Ecosystems Daniel Conley1, Peter M.J. Herman2 and Vincent Escaravage2 1Department of Marine Ecology, National Environmental Research Institute, Roskilde, Denmark and Department of Marine Ecology, Institute of Biological Sciences, University of Aarhus, Denmark 2Netherlands Institute of Ecology, Centre for Estuarine and Marine Ecology, The Netherlands
Nutrient inputs Coastal zone as an active transformer of nutrients Sources, quantification, ratios, time N, P, Si, limitation and eutrophication Introduction Significant advances within the last 2 decades ELOISE, LMER/LTER, LOICZ, National Final thoughts
Modelling N transfer from catchments to estuaries using deterministic models Integrated Nitrogen Model for European catchments (INCA) Wade et al. 2002
A rapid decline in the rate of nitrogen loss with channel size Proximity of sources to large streams and rivers is a major determinant of N transport Alexander et al. 2000 Modelling N transfer: SPARROW SPAtially Referenced Regressions On Watershed Attributes Estimated nitrogen export (kg/km2/yr) Empirically derived estimates from in stream measurements Smith et al. 1997
River Strahler Model Complex Billen and Garnier 2002
Ratios of inputs of N, P and Si have changed with time River Strahler applied to the Danube for periods 1988-91 and 1994-95 Nitrogen loading reductions Large reductions in phosphorus loading Formulations for Si are primitive Long-term changes in DSi transport from building of dams, eutrophication of lakes, and land-use practices Garnier et al. 2002
But… Needs improved temporal and spatial resolution P deposition? Modelling atmospheric nitrogen deposition ANICE and MEAD projects 30% of N loading from atmospheric deposition Wet deposition represents 81% of N deposition Identify sources of N De Leeuw et al. 2002
SCOR/LOICZ Working Group on ground water inputs Estimates of groundwater fluxes are necessary for nutrient budgets Important, but fluxes are notoriously uncertain Buddemeier 1997
Harmonized Procedures for quantification of nutrient losses from diffuse sources (HARP) Developing harmonized modelling tools for integrated basin management
Model assumptions influences final result Used different spatial process and parameter aggregation procedures Figure a - A 50% N reduction could be achieved by focusing on eastern basin Figures b and c predict that reductions should be spread over entire basin Economic and societal consequences Darracq and Destouni 2004
Cyclotella choctawhatcheeana Coscinodiscus asteromphalus Detonula confervacea RS Fragilaria elliptica agg. Cocconeis placentula Melosira moniliformis Opephora mutabilis C. meneghiniana C. scutellum 2000 1980 1960 Year 1940 1920 1900 0 0 0 20 0 20 0 0 20 0 20 0 20 0 % abundance Bradshaw and Rasmussen 2004 Monitoring Long-term Trends in Eutrophication and Nutrients in the Coastal Zone (MOLTEN) Planktonic Benthic Tabularia fasiculata agg. Diatom-inferred TN TN increased from ca. 45 to 90 mM in the last 50 years 0 20 30 50 70 90 110 µ mol l -1 Clarke et al. 2003
Summary of land side Active area of research and development Importance for management, e.g. WFD Need for scenarios Models, models and more models
Significant advances in our understanding of the nitrogen cycle Sediment microalgae are strong competitors for nitrogen Strongly reduced denitrification in autotrophic sediments Seagrass communities also play an important role in N transformations Risgaard-Petersen 2003
Discovery of anaerobic ammonium oxidation (ANAMMOX) in the marine environment NH4+ + NO2- = N2 + H2O Known to occur in WWTP Accounts for up to 65% of N2 production on shelf sediments ANAMMOX is responsible for a significant part of the global N2 production (25-50 %) Dalsgaard et al. 2003
PON 7% DON 12% River inputs of N to Horsens Fjord, Denmark Inputs dominated by nitrate DIN 81% Export from Horsens Fjord PON 0% DIN 17% Extensive transformations Export primarily as DON Availability? Impact on food webs? Impact on coastal zone? DON 83% Cycling of Dissolved Organic Nitrogen (DON) Stedmon et al. 2004
N2O is a greenhouse gas 100x more powerful than CO2 Peak N2O production in the Schelde estuary at low O2 concentrations Low oxygen and some NH4 triggers N2O production in estuaries 600 150 (µM) (%sat) 400 100 O (nM) 4 200 50 NH 2 2 N O 0 0 0 5 10 15 20 25 30 35 Salinity de Bie et al. 2002 N2O and N cycling
Long-term reductions in dissolved silicate in the Baltic Sea Long-term monitoring records of dissolved silica (DSi) show declining concentrations in the Baltic with eutrophication and damming of rivers DSi concentrations are generally not limiting today Within the next 20-30 years DSi limitation will be common causing severe disruption of food webs in the Baltic Sea Papush, Danielson and Rahm (Unpub. Data)
Effects of N, P and Si concentrations and ratios Recognition that differential loading of N, P and Si will effect the response of coastal ecosystems Reductions in Si inputs disrupts diatom-based food web Changes in N:P ratios will effect functional groups of algae Lancelot et al. 2002
Response of functional groups to nutrient forcing in the Danube River 1988-91 Model used as a tool to assess changes in loads Higher nutrient loads increased the diatom- copepod C transfer, but opportunistic species thrive later 1994-95 diatoms nano flagellates opportunistic species copepods meso zooplankton bacteria Mnemiopsis Noctiluca Lowered nutrient levels enhanced the microbial food web Combining model results with increased fishing pressure demonstrated that BOTH were important Lancelot et al. 2002
Regime shifts under eutrophication Responses to eutrophication not always linear Increase the load of nutrients until a sudden shift in ecosystem structure occurs THRESHOLDS De Wit et al. 2001
Summary Coupled models of input and response needed Data, data, data
From a recent EEA Assessment of marine eutrophication in Europe
Summary Coupled models of input and response needed Data, data, data There is a need for long-term ecological research
Thank you very many!