Download
1 / 21
210 likes | 302 Views
3D-Var assimilation of CHAMP measurements at the Met Office Sean Healy, Adrian Jupp and Christian Marquardt. Acknowledgements GFZ Potsdam for providing CHAMP measurements. The Met Office Satellite Applications Section. Outline Theoretical 1D-Var information content

E N D
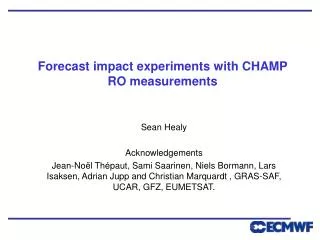
3D-Var assimilation of CHAMP measurements at the Met Office Sean Healy, Adrian Jupp andChristian Marquardt
Acknowledgements GFZ Potsdam for providing CHAMP measurements. The Met Office Satellite Applications Section.
Outline • Theoretical 1D-Var information content • Forward model description • Implementation in 3D-Var • Preliminary impact trial results • Summary
RO - IASI information theoretical 1D-Var information content comparison (Collard and Healy, 2003) Calculation with 1000 IASI channels. RO temperature information content maximum in the 300-50hPa region. RO humidity information near the surface probably over-estimated. We are assuming 1% refractivity error, but recent (Kuo et al, 2003) work suggests 3% is more reasonable.
Forward model used in trial Our refractivity forward model has been written to be consistent with the “New Dynamics” model, which has a staggered height grid. The refractivity forward model uses pressure and specific humidity (or relative humidity) on model height levels to simulate the observed refractivity, N, values at the observation heights.
Forward Model Need to be able to calculate refractivity at arbitrary geopotential heights. We have pressure information on “a” levels and humidity information on “b” levels. Calculate the temperature on the “b” level using the hydrostatic equation. Interpolate the (Exner) pressure to the b level Calculate refractivity on the b level. Interpolate the refractivity to arbitrary observation height. ln(refractivity) varies linearly with height. “b level” heights “a level”
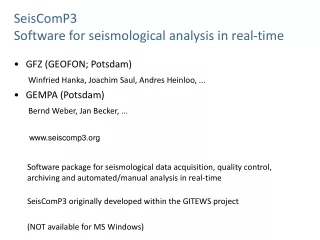
Observation processing system(OPS) 3D-Var assimilation system Pre-process Implementation (1) (2) (3) Produce refractivity as a function of height (Performed by GFZ) Perform 1D-Var retrieval for QC. Assimilate refractivity profiles.
Observation Processing System (OPS) The 1D-Var is used for quality control. We assign a “probability of gross error” (PGE) for each refractivity value in the profile. PGE based on the 1D-Var cost function at convergence and the refractivity residuals. Refractivity residuals - refractivity values calculated with the 1D-Var solution minus the observed values. If the residual is greater than 5 times the observation error PGE = 1.0, the value is not used in the 3D-Var. Cost at convergence: If 2J/m > 20, the PGE of all profile = 1.0 (m = size of observation vector ~120).
Trial Period Close to operational set-up, assimilating ATOVS/sondes... We are assimilating CHAMP refractivity profiles provided by GFZ, between May 26, 2001 - June 11, 2001. 16, 24 hour forecasts. Each profile contains ~120 refractivity values (150 max), with a vertical separation of 200m. Observation errors are based on Kursinski’s estimates, but we have inflated them to 3% at the surface, falling linearly to 0.25% at 10km and include vertical error correlations. However, we do not assimilate refractivity below 4km because of the well known biases. Note, we only obtain ~40 measurements per assimilation cycle (~160 per day).
Main results We do not see any significant improvement in the humidity fields. (Probably because of the 4km lower limit. The amount of humidity information falls with height.) Most significant improvements in temperature between 250-50 hPa, in the southern hemisphere. In the northern hemisphere we can only see an impact around 50hPa (~22 km altitude).
Globally averaged 6 hour forecast temperature differences against radiosonde at 250hPa
Globally averaged 6 hour forecast temperature differences against radiosonde at 50hPa
Summary We have incorporated a SAF refractivity forward model into the Met Office 3D-Var system and tested it with CHAMP measurements. Successfully completed our first forecast impact trial. The trial produced 16, 24 hour forecasts, which have been validated against observations. Humidity information probably limited by the 4km cut-off. We see a positive impact - particularly in the southern hemisphere T250, T50 and H250. PSML in tropics. Encouraging results! A constellation (COSMIC/ACE+) looks an exciting prospect.