Download
1 / 20
200 likes | 321 Views
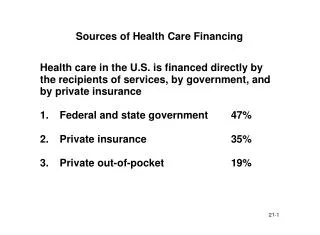
Financing Global Health 2035 Sources of Revenue and Options for Cost Control. Sanjeev Gupta Acting Director of Fiscal Affairs Department International Monetary Fund December 3, 2013 London. Presentation Outline. I. Incremental Costs. I. Incremental costs for convergence.

E N D
Financing Global Health 2035Sources of Revenue andOptions for Cost Control Sanjeev Gupta Acting Director of Fiscal Affairs Department International Monetary Fund December 3, 2013 London
I. Incremental costs for convergence • Low-income countries: US$23bn per year from 2016-25 and US$27bn per year from 2026-35 (or US$24 per person in 2035) • Lower-middle-income countries: US$38bn and US$53bn per year, respectively (or US$20 per person in 2035) • The cost of convergence is around 1% to 3% of GDP depending on the country grouping
II. How to finance convergence Economic growth Mobilization of domestic resources Budgetary reallocations and efficiency gains External resources
II.A Economic Growth GDP and Revenue (GDP = 100 for t = 0, a constant revenue share of 14% and 4.5 % real growth annually) • During 1990 to 2011, economic growth averaged between 3.9% and 5.1% for different country groups • Going forward, growth above 4% is forecast. At 4.5% growth, there is more than a doubling of revenues in 20 years
II.B Mobilization of Domestic Resources Government Revenue (without grants) by Country Group* 1990-2011 (percent of GDP) Upper middle income (GNI per capita $4,086 to $12,615) Lower middle income (GNI per capita $1,036 to $4,085) Low income (GNI per capita $1,035 or less) *The World Bank Country Classification
II.B Government Revenue Composition1990-2011 (percent of GDP) Low income Lower middle income Upper middle income
II.C Budgetary Reallocations andEfficiency Gains • Reallocate fiscal resources from unproductive to productive/high-priority spending, including health • Large energy subsidies on air-polluting fuels ( e.g.,3.5 % of GDP in sub-Saharan Africa; governments there spend more on subsidies than on health) • Scope for efficiency gains within health sector • Some potential for increasing efficiency in the sector; this could free resources for expanding critical health services, thus improving health outcomes
II.D External Resources • The need for external resources to finance convergence will depend on the increase in public health spending from current levels • Two scenarios: public health spending rises to 3% of GDP or 4% of GDP • Only under 3% scenario would LICs need external support. In lower-middle-income countries, domestic resources and non-concessional loans from World Bank and regional development banks are likely to suffice
III. Options to Curb Cost Escalation Hard budget constraints Reference pricing Reduction of fee-for-service payments Additional approaches
Large spending increases in advanced economies over past 40 years Health Spending in Advanced Countries (percent of GDP) Periods of Acceleration
Increases in public health spending were much smaller in emerging economies Health Spending in Emerging Countries (percent of GDP)
Main drivers of public health spending • Population aging • Technology • Health policies and institutions • Expansion in coverage • Baumol effect
III.A,B Hard Budget Constraints andReference Pricing • Hard budget constraints raise awareness of costs • Tight constraints raise risk of under-provision • Encourage greater private expenditure; need to protect interests of the poor • Reference pricing imposes cap on how much the public sector will pay for a specific drug or procedure • Requires country-specific information on cost structures
III.C Fee-for-service Payments to Providers • Fee-for-service payments reward quantity over quality and do not promote prevention or patient education • Paying salaries or by capitation can reduce costs, while results-based payments can improve outcomes • Fee-for-service payments can still play a role though where essential services are under-provided
III.D Additional Approaches • Single payer approach • Reduces administrative costs • Controlling health care supply • Promoting use of generic drugs or restricting new technologies through health technology assessments (e.g., South Africa and Thailand) • Gate-keeping • Primary care provider as first point of contact for patient • Private financing • Cost-sharing limited to high income patients for low-value interventions. Rwanda is exempting the poor, but using cost-sharing to raise revenues
III.D Additional Approaches • Strategic purchases such as contracts between government and private providers or between different tiers of government is another avenue • Taking steps to postpone incidence of non-communicable diseases (NDCs) • Low-income and middle-income countries could otherwise see significant increases in medical costs of NDCs