Download
1 / 57
941 likes | 2.03k Views
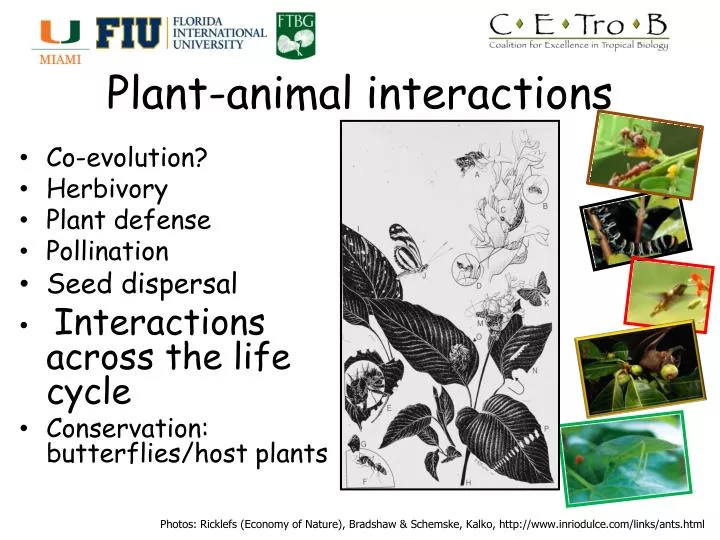
Plant-animal interactions. Co-evolution? Herbivory Plant defense Pollination Seed dispersal Interactions across the life cycle Conservation: butterflies/host plants. Photos: Ricklefs (Economy of Nature), Bradshaw & Schemske, Kalko, http://www.inriodulce.com/links/ants.html.

E N D
Plant-animal interactions • Co-evolution? • Herbivory • Plant defense • Pollination • Seed dispersal • Interactions across the life cycle • Conservation: butterflies/host plants Photos: Ricklefs (Economy of Nature), Bradshaw & Schemske, Kalko, http://www.inriodulce.com/links/ants.html
TODAY: Interactions across the life cycle • Definitions and issues • Life cycle diagram • Interactions happen at certain stages • Fitness components • Fitness • Constant world • (Variable world) • Traits • Example
LIFE CYCLE DIAGRAMa population dynamics model Individuals in each stage, from one year to the next, may survive (Survival) may change life stage (Growth) may reproduce by a certain amount (Reproduction) The probabilities/rates are written on these arrows
STAGE SPECIFIC INTERACTIONS Interactions influence particular rates and probabilities
FITNESS COMPONENTS FITNESS : representation in future population Depends upon ALL probabilities/rates Each probability/rate is a FITNESS COMPONENT
FITNESS FITNESS : Per capita rate of increase for a population that has these rates Calculated using matrix analysis represented by λ
Sequence of environments … 1 1 2 3 4 5 6 7 8 9… … 10 10 10 10 10 10 10… Environmental transition probabilities Life cycle probabilities/rates & animals vary among environments
Sequence of environments … 1 1 2 3 4 5 6 7 8 9… … 10 10 10 10 10 10 10… Environmental transition probabilities Life cycle probabilities/rates & animals vary among environments
FITNESS : Per capita rate of increase for a population in this changing environment Calculated using stochastic sequence matrix analysis Represented by λs
So… • Animals - affect Rates on arrows • Rates on arrows - Fitness • Animals - affect-------------- Fitness
TRAITS? Plant traits may influence the effects of animals • Animals - affect Rates on arrows • Rates on arrows - Fitness • Animals - affect-------------- Fitness
TODAY: Interactions across the life cycle • Definitions and issues • Life cycle diagram • Interactions happen at certain stages • Fitness components • Fitness • Constant world • (Variable world) • Traits • Example
Part I. The effects of animals on fruit production and fatesof a neotropical herb
Laguna encantada Laguna Encantada, Los Tuxtlas Veracruz, MEXICO
Effects of animals on “fitness components” • Within the year natural variation among individuals: fruit production • Between years natural variation among individuals: fates the subsequent year • Within the year experimentally induced variation in herbivores and antguards: fruit production
Natural variation in parameters quantified for individual plants in the field
Effects of animals & covariates Pollinator visits, antguards, herbivory of reproductive tissues -> flowers, initiated and mature fruits Schemske & Horvitz, 1988. Ecology 69: 1128-1137 Size, herbivory of leaves, competition, fruits -> survival, growth, inflorescence production Horvitz & Schemske 2002. Journal of Ecology 90: 279-290
Animals& covariates Antguards Herbivory of reproductive tissues Pollinators Size Herbivory of leaf tissues Neighbors Fruits
Animals & covariates • Antguards • Herbivory of reproductive tissues • Pollinators • Size • Herbivory of leaf tissues • Neighbours • Fruits
Path analysis: effects of animals on reproduction Eurybia Pol 1 Pol 2 Pol 3 Mature fruits Initiated fruits Flowers Ants
Eurybia elvina (Riodinidae)
Eurybia elvina (Riodinidae)
Animals influencing fruit production within a season • Antguards (many taxa) • Herbivory of reproductive tissues • Eurybiaelvina (Riodinidae) • Number of visits by pollinators • Euglossaspp • Eulaemacingulata • Eulaemapolychroma • Exaeretesmaragdina • Rhathymussp
Conclusions: effects of animals on flower and fruit production Ants: + direct on flower production, both yrs Ants: + indirect on fruit production, both yrs Eurybia: - direct on flower production, both yrs Eurybia: - direct on fruit production, both yrs Pollinators: + direct on fruit initiation, 1 yr only (the year with more abundant high quality visitors)
Animals & covariates Antguards Herbivory of reproductive tissues Pollinators Size Herbivory of leaf tissues Neighbors Fruits
Animals & covariates in one yearacting on fates the following year Current size (leaf area, cm2) Herbivory of leaf tissues (% leaf area gone) Neighborhood competition (leaf area, cm2) Fruits produced
Path analysis for effects of animals & covariates on survival probability Size Herbivory Neighbors [Fruits] Survival
Path analysis for effects of animals & covariates on growth rate Size Herbivory Neighbors [Fruits] Relative growth
Path analysis for effects of animals & covariates on reproduction Size Herbivory Neighbors [Fruits] Inflore- scences
Separate analyses for each dependent variableby stage and year (total of 55 analyses!) • Seedlings • Juveniles • Pre-reproductives • Reproductives • 1982 • 1983 • 1984 • 1985 • 1986
Conclusions: effects of animals (& covariates) on probabilities/rates Size: important for all stages, improving survival (of smallest ones) and improving reproduction, but slowing down relative growth. Herbivory: very low in general; it had mysterious negative effects in 1985, not the year it was highest. Competition: strongest negative impact on seedlings, but also had temporal pattern (partially) consistent with its strength. Fruit production: positive impacts on future growth and future reproduction.
Effects of herbivores and antguards on fitness: experimental results combined with population study Maron, Horvitz &Williams 2010. J. Ecol. 98: 290-301 based on data in experiment : 600 plants for 9 wks: Horvitz & Schemske 1984 . Ecology 65:1369-1378 population: >5,000 plants over 6 yrs : Horvitz & Schemske 1995. Ecological Monographs. 65:155-192.
Part II. Selection on traits affecting interactions of animals with plants in variable environments
“Tripping” mechanism • Insects with short tongues • have to get heads deeper in • Short floral tubes ?=? • higher fruit set • Yes, if short-tongued insects are abundant • No, if short-tongued insects are absent
Short-tongued visitors = efficient pollinators Rarely seen One year: More abundant That year: Counts of visits by pollinators explained significant variation in fruit production >21,000 floral visits observed 1984, 1985, 1986 Schemske & Horvitz 1984. Science 225:519-521 Schemske & Horvitz 1988. Ecology 69:1128-1137
a small tropical Mexican herb Floral tube length (pollinator related) 3 yrs of selection gradients Fruit production Demographic projection matrices for 4 yrs Regional environmental dynamics
SELECTION Relative fitness regressed against quantitative trait value The slope of the regression = selection gradient for the trait (Lande and Arnold 1983 Evolution) fitness something quantitative
FITNESS : Per capita rate of increase for a population in this changing environment Calculated using stochastic sequence matrix analysis Represented by λs
SELECTION across the life cycle • stage-specific elasticity , eij = change in λ due to a change in one element of the matrix X • selection gradient = change in one element of the matrix due to a change in the trait value = regression of fitness component on trait (van Tienderen 2000 Ecology, Coulson et al. 2003 Evolution)
SELECTION ACROSS THE LIFE CYCLEin variable environments • Environment-specific elasticity, eijβ= change in λS due to a change in one matrix element in one state of the environment X • selection gradient = change in one matrix element in one state of the environment due to a change in the trait value = regression of fitness component on trait Horvitz, Coulson, Tuljapurkar, Schemske (2010)
Environmental variation in stage-specific demographic rates Environmental variation in stage-specific selection gradients* *Slopes for analyses of fitness components regressed against trait.
ENVIRONMENTAL TRANSITION RULES FROM HISTORY Study years (open bars) in context of long-term climate data Assign each historical year a set of rates from one study year Let historical sequence determine environmental transition rules Rainfall in the Dry Season,mm [9.3, 111.7] μ = 57.1, σ= 25.2: meanmonthly precipitation (mm) records Nov-May town of San Servicio Nacional de Meterologia of Mexico. Data are expressed as the annual deviation from the mean divided by the standard deviation
Sequences for hypothetical environmental drivers …1 3 2 1 1 1 1 3 1 3 1 3 2 1 1 1… climate :Dry Season Rainfall ……1 1 2 2 2 2 2 2 3 3 3 3 3 3 3 3… one alternative: Environmental Stasis