Download
1 / 44
440 likes | 566 Views
Effect of -Carotene Supplementation on the Risk of Lung Cancer. ATBC (Finnland, 1994 >29 000 smokers) β -carotene (20 mg/day/5-8 years) Lung cancer 18% CARET (USA, 1996, 18 000 participants) 30 mg ß -carotene and 25,000 IU retinil- palmitate Lung cancer 28%.

E N D
Effect of -Carotene Supplementation on the Risk of Lung Cancer • ATBC (Finnland, 1994 >29 000 smokers) β-carotene (20 mg/day/5-8 years) Lung cancer 18% • CARET (USA, 1996, 18 000 participants) 30 mg ß-carotene and 25,000 IU retinil- palmitate Lung cancer 28%
Tea Consumption and Esophageal Cancer I. • Green tea consumption statistically significantly decreased the risk of esophageal cancer (OR: 0.50; 95% CI = 0.30-0.830) (Gao YT, McLaughlin JK, Blot WJ, et al.Reduced risk of esophageal cancerassociatedwith green tea consumption. J Natl Cancer Inst 1994;86:855-888.)
Tea Consumption and Esophageal Cancer II. Daily tea consumption (g tea leaves) in Northern Iranian regions: (Hormozdiari, 1975)
Regular Intake and Supplementation Level of -Carotene mg/day
Factors Affecting the Antioxidant/Prooxidant Properties of -carotene • Concentration • Presence of certain prooxidant compounds • Oxigene-concentration • Presence of other antioxidants
Temperature of Tea at Consumption in Different Regions of Iran (Ghadirian, 1987)
Factors Concerning Tea Consumption • Sort and quality of tea (green, oolong, black) • Preparation method (water temperature, soaking time) • Water quality (hardness, contaminants) • Quality of dishes, contaminants • Sweetening (sugar) • Temperature at consumption
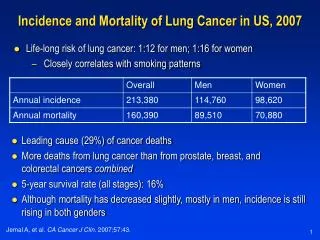
Lifetime Probability of Developing Cancer, by Site, Men, US, 1997-1999 All sites 1 in 2 Prostate 1 in 6 Lung & bronchus 1 in 13 Colon & rectum 1 in 17 Urinary bladder 1 in 29 Non-Hodgkin lymphoma 1 in 47 Melanoma 1 in 57 Leukemia 1 in 69 Oral cavity 1 in 71 Kidney 1 in 72 Stomach 1 in 79 Source: Surveillance, Epidemiology, and End Results Program, 1973-1999, Division of Cancer Control and Population Sciences, National Cancer Institute, 2002.
Lifetime Probability of Developing Cancer, by Site, Women, US, 1997-1999 Risk All sites 1 in 3 Breast 1 in 8 Lung & bronchus 1 in 17 Colon & rectum 1 in 18 Uterine corpus 1 in 37 Non-Hodgkin lymphoma 1 in 56 Ovary 1 in 58 Pancreas 1 in 80 Melanoma 1 in 81 Urinary bladder 1 in 88 Uterine cervix 1 in 123 Source: Surveillance, Epidemiology, and End Results Program, 1973-1999, Division of Cancer Control and Population Sciences, National Cancer Institute, 2002.
African American Cancer Survival*(%) by Site and Race,1992-1998 White % Difference All Sites 64 53 11 Breast (female) 88 73 15 Colon & rectum 63 53 10 Esophagus 15 8 7 Leukemia 47 38 9 Non-Hodgkin lymphoma 56 46 10 Oral cavity 59 35 24 Prostate 98 93 5 Urinary bladder 82 65 17 Uterine cervix 72 60 12 Uterine corpus 86 61 25 *5-year relative survival rates based on follow up of patients through 1999. Source: Surveillance, Epidemiology, and End Results Program, 1973-1999, Division of Cancer Control and Population Sciences, National Cancer Institute, 2002.
Relative Survival* (%) during Three Time Periods by Cancer Site 1983-1985 1992-1998 1974-1976 • All sites 50 52 62 • Breast (female) 75 78 86 • Colon & rectum 50 57 62 • Leukemia 34 41 46 • Lung & bronchus 12 14 15 • Melanoma 80 85 89 • Non-Hodgkin lymphoma 47 54 55 • Ovary 37 41 53 • Pancreas 3 3 4 • Prostate 67 75 97 • Urinary bladder 73 78 82 *5-year relative survival rates based on follow up of patients through 1999. Source: Surveillance, Epidemiology, and End Results Program, 1973-1999, Division of Cancer Control and Population Sciences, National Cancer Institute, 2002.
*Per 100,000, age-adjusted to the 2000 US standard population. †Hispanic is not mutually exclusive from whites, African Americans, Asian/Pacific Islanders, and American Indians. Source: Surveillance, Epidemiology, and End Results Program, 1973-1999, Division of Cancer Control and Population Sciences, National Cancer Institute, 2002. Cancer Death Rates*, by Race and Ethnicity, 1992-1999
Change in the US Death Rates* by Cause, 1950 & 2000 Rate Per 100,000 1950 2000 HeartDiseases CerebrovascularDiseases Pneumonia/Influenza Cancer * Age-adjusted to the 2000 US standard population. Source: US Mortality Volume 1950, National Vital Statistics Report, 2002, Vol. 50, No. 15.
Cancer Sites in Which African-American Death Rates* Exceed White Death Rates* for Men, US, 1995-1999 Ratio of African American/White African American White • All sites 359.2 253.0 1.4 • Larynx 5.8 2.4 2.4 • Prostate 72.8 31.2 2.3 • Stomach 14.2 6.3 2.3 • Myeloma 9.2 4.5 2.0 • Oral cavity and pharynx 8.3 4.2 2.0 • Esophagus 12.9 7.2 1.8 • Liver 9.2 5.9 1.6 • Lung & bronchus 109.1 79.7 1.4 • Pancreas 16.2 12.0 1.4 • Small intestine 0.7 0.5 1.4 • Colon & rectum 34.4 25.8 1.3 *Per 100,000, age-adjusted to the 2000 US standard population. Source: Surveillance, Epidemiology, and End Results Program, 1973-1999, Division of Cancer Control and Population Sciences, National Cancer Institute, 2002.
Cancer Sites in Which African-American Death Rates* Exceed White Death Rates for Women, US, 1995-1999 African-American Ratio of African American/White White • All sites 203.5 169.8 1.2 • Stomach 6.8 3.0 2.3 • Myeloma 6.8 3.0 2.3 • Uterine cervix 6.2 2.8 2.2 • Esophagus 3.5 1.7 2.1 • Larynx 0.9 0.5 1.8 • Uterine corpus, NOS 6.9 3.9 1.8 • Soft tissue, including heart 1.9 1.3 1.5 • Colon & rectum 25.4 18.0 1.4 • Pancreas 13.0 9.0 1.4 • Liver & intrahepatic bile duct 3.9 2.8 1.4 • Breast 37.1 28.2 1.3 • Urinary bladder 3.1 2.3 1.3 *Per 100,000, age-adjusted to the 2000 US standard population. Source: Surveillance, Epidemiology, and End Results Program, 1973-1999, Division of Cancer Control and Population Sciences, National Cancer Institute, 2002.
Different locations have different rates of cancer. Why does China have a 50x higher rate of liver cancer than Canada? Why does US have a 20x higher colon cancer rate than India? • Epidemiological studies of human cancer Can't do highly controlled studies as for animals. Immigrant studies--track cancer incidence among individuals that have immigrated to country. • Japanese women in JapanJapanese immigrants to USRates of cancer: Rates of cancer: After one or Stomach cancer high,two generations, develop breast cancer lowcancer patterns like other US women
Daganatincidenciák afrikai és amerikai fekete népesség körében Daganat Nem Nigéria USA 1960-69 Feketék Fehérek Vastagbél férfiak 34 349 294 Végbél férfiak 34 159 217 Máj férfiak 272 67 39 Hasnyálmirigy férfiak 55 200 126 Gége férfiak 37 236 141 Tüdő férfiak 27 1,546 983 Prosztata férfiak 134 724 318 Emlő nők 337 1,268 1,828 Méhnyak nők 559 507 249 Méhtest nők 42 235 695 Limfoszarkoma férfiak 133 10 4
Daganatincidenciák japán őslakosság és hawaii bevándorlók körében Hawaii, 1968-72 Daganat Nem Japán Japán Kaukázusi Nyelőcső férfiak 150 46 75 Gyomor férfiak 1,331 397 217 Vastagbél férfiak 78 371 368 Végbél férfiak 95 297 204 Tüdő férfiak 237 379 962 Prosztata férfiak 14 154 343 Emlő nõk 335 1,221 1,869 Méhnyak nők 329 149 243 Méhtest nők 32 407 714 Petefészek nők 51 160 274
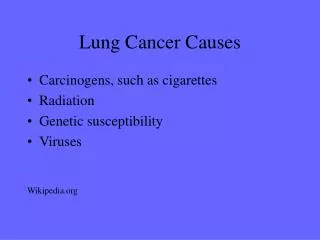
Factors Contributing to the Incidence of Human Cancer Diet (35%) Tobacco (30%) Reproductive & Sexual behavior (7%) Infection (10%) Occupation (4%) Geophysical Factors (3%) Alcohol (3%) Pollution (2%) Food Additives (<1%) Medicines (1%) Industrial Products (1%) Unknown (?) Adapted from Doll, R. and Peto, R.(1981) The Causes of Cancer. Oxford Medical Publications.
Causes of cancer • Nutrition 35% • Smoking 30% • Infections 10% • Sexual behaviour 7% • Occupation 4% • Alcohol 3% • Geophysical factors 3% • Pollution, others 2% 0% 10% 20% 30% 40%
Trends in Overweight* Prevalence (%), Adults 18 and Older, US, 1992-2001
Urban industrial pollution dietary fat intake sedentary lifestyle occupational hazards Rural sun exposure accessibility of medical care meat consumption **toxic chemicals from fertilizers Geography and occupation influence cancer risk
Standardized mortality ratios for breast (F) and stomach (M) cancer among American residents of Japanese Ancestry and White Americans (SMR relative to rate in Japan) 300 200 100 0 Breast (F) Stomach (M) Standardized Mortality Rate Japanese 1st generation migrants 2nd generation migrants US white males Japanese 1st generation migrants 2nd generation migrants US white females Preventable Convergence towards host cancer rates 70-90% of Cancer is Preventable Large influence of lifestyle and environment
Population Impact Population Attributable Risk % Percent of cancer cases attributable to a risk factor = Function of exposure prevalence and increase in risk High exposure to benzene in certain occupations increases bladder cancer risk 8 fold Smoking associated with a 4-fold increase bladder cancer risk Which exposure has a larger impact on the number of bladder cancers?
Major Causes of Cancer - Tobacco * Cancer site Relative Risk PAR% Lung 10-12 80-90% Oral 8-10 60-90% Esophogus 7-9 70-80% Bladder 4-6 40-50% Pancreas 3-5 29-34% Most important cause of cancer Smoking usually multiplies the background rates * Source - Cancer Epid and Prevention, Shottenfield and Fraumeni
Major Causes of Cancer - Diet Cancer site Diet factors PAR%* Colorectal Fat and vegetable 60% Breast Fat and vegetable 27% Prostate Fat consumption 20% Stomach Nitrite, fruit and vegetable 70% Pancreas Sugar, vegetable 30% Complex to study Risks not well understood - nutrients vs individual foods vs patterns No single factor shows a strong and consistent relationship * Miller - Chronic Diseases in Canada 1992
Major Causes of Cancer - Viruses Factor Cancer sites Human Papillomaviruses (HPV) Cervix Helicobacter pylori Stomach Hepatisus B (HBV) Liver Ebstien-Barr (EBV) Lymphoma HIV N-H Lymphoma, Kaposi’s sarcoma Strong evidence for an infective etiology of childhood leukemia - pattern of occurrence tends to cluster like infectious disease
Major Causes - Reproductive and hormonal factors Protective Factors late age at menarche early age at menopause early first childbirth high parity Risk factors Oral contraceptive use Estrogen replacement therapy Chemicals (PCB) which mimic estrogens Breast cancer risk influenced by endogenous and exogenous hormones
Occupation Cancer Sites Agricultural Leukemia, Testes, Lung Cement Lung Mining Lung, Stomach, Leukemia Dry Cleaning Bladder, Kidney, Cervix, Lung Firefighters Brain, Lung Oil Refinery Leukemia, Bone, Brain, Kidney, Pancreas, Skin, Lymphatitc Major Causes of Cancer - Occupation Several occupations, and exposures within these occupations are linked to high risk for cancer An important starting point for epidemiologic studies of specific exposures - e.g. study highly exposed populations
Major Causes of Cancer - Genetics Factor Prevalence RR PAR Mutations Low High Low Polymorphisms High (> 1%) Low High Causes of Breast Cancer Prevalence RR PAR BRCA1/BRCA2 Very low Very High 2% Specific genetic mutations which are associated with a very high probability for developing cancer, may account for relatively few cases because they are present in a small proportion of the underlying population
Major Causes of Cancer - Gene-Environment Interactions Polymorphism (NAT2) Slow acetylation Fast acetylation Bladder cancer relative risk Bladder cancer relative risk associated with smoking = 8 associated with smoking = 1.5 Interaction - effect of smoking is different in subjects with a specific polymorphic gene - better understanding of the effects of established carcinogens - uncover low levels of risk previously masked by genetic susceptibility
Summary Epidemiologic evidence suggests that a substantial proportion of cancer mortality and morbidity can be prevented Lifestyle and Environmental factors play an important role - smoking - diet - hormonal - UV radiation - occupation - air and water Risk factors for many cancer sites still poorly understood Investigation of gene-environment interactions has enormous potential to contribute to the understanding of cancer risk Major role for epidemiology in identifying preventable risk factors
Epidemiologic Study Designs Experimental Intervention / Randomized Controlled Trial Observation Cohort study Case-Control study
Methodological considerations in observation studies CONFOUNDING Exposure (Exhaust) Outcome (bladder cancer) Confounder (Smoking) Potential confounders Smoking Physical activity Diet
Egyes daganatok kezelésének relatív költségei Daganat Fejlett országok (%) Fejlődő országok (%) Tüdő 122 782 Máj 113 727 Nyelőcső 111 709 Leukémia 109 700 Gyomor 107 687 Kolorektális 105 336 Ajak-szájüreg 76 243 Emlő 65 206 Méhnyak 54 174 Átlag 100 641