Download
1 / 22
220 likes | 226 Views
Cooperative Monitoring of Reactors Using Antineutrino Detectors – Report on Progress . Lawrence Livermore National Laboratory. Sandia National Laboratories California. Collaborators. Stanford University Giorgio Gratta, Yifang Wang. Nathaniel Bowden (P.I.) John Estrada Jim Lund

E N D
Cooperative Monitoring of Reactors Using Antineutrino Detectors – Report on Progress Lawrence Livermore National Laboratory Sandia National Laboratories California Collaborators Stanford University Giorgio Gratta, Yifang Wang Nathaniel Bowden (P.I.) John Estrada Jim Lund Matt Allen Tony Weinbeck N. Mascarhenas Tony Jacobson University of Alabama Andreas Piepke Oak Ridge National Laboratory Ron Ellis Adam Bernstein, (P.I.) Celeste Winant Chris Hagmann Norm Madden Jan Batteux Dennis Carr Southern California Edison and The San Onofre Nuclear Generating Station Management and Staff Work supported by DOE NA-22, Office of Nonproliferation Engineering This work was partially performed under the auspices of the US Department of Energy by the University of California, Lawrence Livermore National Laboratory, under contract No. W-7405-Eng-48.
How Much Plutonium is There in the World ? http://www.isis-online.org/global_stocks/old/summary_tables.html#chart1
Civil Plutonium Flows are Monitored by the International Atomic Energy Agency (IAEA): How Do They Do It ? Cooling pond/dry-cask storage Reprocessing Plant/fuel fabrication Power Reactors ~200 under IAEA safeguards Underground Repository (months to years) (months) (1-1.5 years) (forever) + Check declarations + Containment + Surveillance +Containment + Surveillance + Various NDA methods for estimating Pu inventory +Containment + Surveillance + Cerenkov light + Neutrons + Assay
What Good is Antineutrino Monitoring? • Verify declarations of plutonium content with a direct measurement shipper-receiver difference • Early detection of unauthorized production of plutonium outside of declarations at tens of kg levels • Checking progress of plutonium disposition, and ensure burnup is appropriate to core type + An integral, continuous, high statistics, non-intrusive, unattended measurement suitable for IAEA and other reactor safeguards regimes + Utilities might benefit from independent power measurement or improved knowledge of burnup – this would change the cost-benefit calculus
Some Basic Properties of Antineutrinos • Antineutrinos are directly produced by fission: • about 6 per fission • Rates near reactors are high • 0.64 ton detector • 25 m from reactor core • Typical core thermal power = 3.46 GW • ~4000 events/day for a 100% efficient detector • Rate and spectrumare sensitive to the isotopic composition of the core • About 250 kg of Plutonium is generated during the cycle • The antineutrino rate changes by 5-10% through a 300-500 day cycle, due to Pu ingrowth specific change depends on fuel, reactor, power history…
“The Burnup Effect”: the Antineutrino Rate Varies with Time and Isotope Pu-241 U-238 Rate of Antineutrinos/Fission Varies With Isotope Relative Fission Rates Vary in Time
The Simplest Operational Implementation Use the observed change in the total antineutrino rate to measure burnup count rate (percentage relative to beginning of cycle BOC) 100% of rate - B.O.C. 93-96% of rate - E.O.C 30% of rate – background days The systematic shift in inventory is reflected by the changing antineutrino count rate over time We must normalize with power in this simple case
Monitoring Reactors with Antineutrino Detectors • 1 ton antineutrino detector placed a few tens of meters from the reactor core • Compare measured and predicted total daily or weekly antineutrino rates (or spectrum) to search for anomalous changes in the total fission rate - normalize with thermal power measured to 1% accuracy • Extract changes in fissile content based on changes in antineutrino rate • Measured in previous experiments • Kurchatov/Rovno quotes 540 kg +- 1% fissile content from shape analysis • We expect sensitivity to a change of a few tens of kilograms of fissile materials (Pu U) is possible with a relative measurement • ‘rate + shape’ analysis could eliminate need for normalization with reactor power
Benefits and Obstacles for Adoption by the IAEA Antineutrino monitoring could provide: • An inventory measurement good to tens of kg early in the fuel cycle • Reduced frequency of inspector visits ($9000 per inspector-day) • Reduced reliance on surveillance and bookkeepingBut: • Cost and footprint must be small • Reactor layout must allow for deployment with overburden • IAEA has other pressing safeguards problems IAEA has requested a feasibility study in ’06 andhas asked for the results of our experimental studies
Testing the Idea at a Reactor Site 25 meters standoff from core A crack team of investigators 20 meter overburden suppresses muons by x5
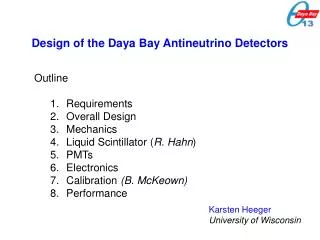
Cutaway Diagram of the LLNL/Sandia Antineutrino Detector Currently operational: 4 cells instrumented with 2 pmts each; 0.64 tonnes of Gd-scintillator; quasi-hermetic muon veto hermetic water shield Gd-doped
How Do We Detect Antineutrinos ? • The antineutrino interacts with a proton producing… • A 0-7 MeV positron (+ annihilation gammas) • A neutron which thermalizes, captures and creates a delayed 8 MeV gamma cascade • mean time interval 28 μsec ~ capture time of neutron • Both final state particles deposit energy within 0-100 μsec • Both energy depositions and the time interval are measured • The time since the most recent muon is also measured
Events that mimic antineutrinos (Background!) • Antineutrinos are not the only particles that produce this signature • Cosmic ray muons produce fast neutrons, which scatter off protons and can then be captured on Gd • Important to tag muons entering detector and shield against fast neutrons – overburden very desirable • Recoiling proton • Immediate • ~ MeV • Neutron • Delayed (t = ~28 ms) • ~ 8 MeV gamma shower
Finding the Energy Scale using ‘Singles’ Data • Full energy peaks not available in this small detector • We must compare data to a simulation to extract an energy scale • Model includes: • Assumed U/Th/K concentrations • MCNP for particle transport • z dependence of light collection • gaussian smearing to account for photostatistics Monte Carlo Singles Data Monte Carlo Simulates U/Th/K only – excess from fast neutrons, clipping muons
Antineutrino Selection Criteria Criterion → Detection Efficiency 4-cell Prompt Energy > 3 MeV → 0.6 (analytic) 4-cell Delayed Energy > 4 MeV → 0.4 (n/ transport MC) 10 < Interevent Time < 100 sec → 0.7 (analytic) Time Since Last Muon >100 sec → 0.94 (deadtime) Abs((pmt1-pmt2)/(pmt1+pmt2))<0.4 → 0.85 efficient (GEANT) Predicted total efficiency = 12% “Measured” efficiency = 10% = (Detected Number of Events)/(Predicted)
The Time Distributions Behave As Expected Time since last muon Inter-event time accept events with t > 100 μsec The muon veto works as it should And induces only ~ 6% deadtime The antineutrino time distribution is well fit by the predicted 28 μsec exponential The background time distribution well fit by singles rate time constant Relative amplitudes for signal and background are extracted from data
Energy Distributions Are Also Consistent With Antineutrinos Prompt Energy (positron + gammas)
The Delayed Energy Spectrum via Subtraction Inter-event Time • Perform statistical separation to extract delayed (Gd shower) energy spectra Delayed Energy
Daily Power Monitoring Using Only Antineutrinos Net 400 events/day
A Preliminary Indication of the Burnup Effect Maintaining detector stability is our key concern
Next Steps • Continue data taking through the next shutdown • Exploit recently installed LED and charge injector to study stability • Show the IAEA how the method fits into the current safeguards regime • Pursue worldwide collaborations – France, Brazil, Russia…deployment in a country subject to safeguards would be an important ‘psychological’ breakthrough Wide deployment in a few years is possible with IAEA approval
Conclusions • Antineutrinos can track burnup and plutonium inventory • This has been firmly established by prior experiments and is being confirmed by us with a practical device • The technology fills an important niche • But IAEA must be convinced that it really improves their regime • Detector deployment is essential for demonstrating practical utility • Strong overlap with detector development for next generation neutrino oscillation experiments (and coherent scatter detection !) • Main technical challenges : • Stable operation • Reliable extraction of burnup and plutonium content • Shrink footprint and improve efficiency 5) Main challenge for the program overall • Demonstrate that it is worth the cost of deployment