Download
1 / 49
520 likes | 1.13k Views
Intelligence and Testing. Chapter 8. What is intelligence ?. intelligence: A general term referring to the ability to learn and develop adaptive behaviors. intelligence tests: Tests designed to measure a person’s general mental abilities. Theories of Intelligence.

E N D
Intelligence and Testing Chapter 8
What is intelligence? • intelligence: A general term referring to the ability to learn and develop adaptive behaviors. • intelligence tests: Tests designed to measure a person’s general mental abilities.
Theories of Intelligence • Charles Spearman’s genreal intelligence “g” • L. L. Thurstone’s Seven Mental Abilities • Raymond B. Cattell's Two-Factor Theory • Robert Sternberg’s Triarchic Theory • Howard Gardner’s Theory of Multiple Intelligences
Charles Spearman’s Theory • “g” factor (general intelligence): Spearman stressed a general mental energy that can be channeled in various directions. Intelligent people can perform well in many areas. • s factors (specific intelligence): reflect specific knowledge and abilities that are only used when performing specific tasks that have been leaarned.
Thurstone’s Seven Primary Mental Abilities • In contrast, L. L. Thurstone said primary mental abilities are “independent” of each other. A person could excel in one area and be very average in others. • Thurstone’s seven primary mental abilities: spatial visualizations verbal meaningword fluency number facility memory reasoningperceptual speed
Experiential Componential Contextual Sternberg’s Triarchic Theory We all share these three types of intelligence but excel in ore or two areas
Sternberg’s Triarchic Theory • componential: Ability to acquire new knowledge and solve problems effectively (intelligence as we think of it). • experiential: The ability to adapt creatively in new situations (ability to meet new challenges). • contextual: Ability to select “contexts” in which you can excel (e.g., being able to make the right career choice).
Gardner’s Theory of Multiple Intelligences Much like Thurstone, Gardner suggests, seven “independent”areas (types) of intelligence. • logical-mathematical - Newton, Einstein • linguistic - Whitman, Shakespeare • spatial - Picasso, DaVinci, F. L. Wright • musical - Mozart, Gershwin, Eric Clapton • body-kinesthetic - M. Jackson, M. Jordan • interpersonal - Ghandi,Carter, Nixon • intrapersonal - to know oneself
Gardner’s Theory • logical-mathematical: Ability to handle chains of reasoning, numerical relations, and hierarchical relations. • linguistic: Sensitivity to the meaning and order of words, as well as the functions of language. • spatial: Ability to perceive the world accurately and to transform and recreate perceptions. • musical: Sensitivity to pitch, tone, timbre, and musical patterns.
Gardner’s Theory • body-kinesthetic: Ability to use one’s body or to work with objects in highly differentiated and skillful ways. • interpersonal: Ability to notice and make distinctions among the moods, temperaments, motivations, and intentions of others. • intrapersonal: Ability to understand one’s own feelings and use them to guide behavior.
Daniel Goleman: Emotional Intelligence • Relatively new area of study • understanding and managing one’s own emotions is probably MORE vital to success than pure intellectual ability • Many highly successful people are not brilliant and many geniuses die in poverty • Understanding the emotions of others is also important. It allows us to predict how they will act in various situations
Raymond Cattell: Two Factor Theory(not in book) • fluid intelligence: General mental energy (like “g”). like a fluid, it “shapes” itself to the task (e.g., math, music, chemistry). • crystallized intelligence: Knowledge that is “learned” or accumulated over a lifetime. • Crystallized intelligence is more stable across the lifespan whereas fluid intelligence begins a slow decline in middle adulthood.
Cattell’s Other Contributions • Personality: A leader in personality theory and testing as well • Cattell developed the “16 pf (personality factor) Inventory” • He applied the technique of “factor analyses” (deveoped by Spearman) to the study of intelligence and personality • Factor Analysis: statistical (mathematical) method for identifying the basic “factors” of intelligence and personality
Intelligence Tests • The Binet-Simon Scale • The Stanford Binet • The Weschler Scales • WAIS (Weschler Adult Intelligence Scale) • WISC (Weschler Intelligence Scale for Children) • WPPSI (Weschler Preschool/Primary Scales of Intelligence) • culture fair tests • performance tests
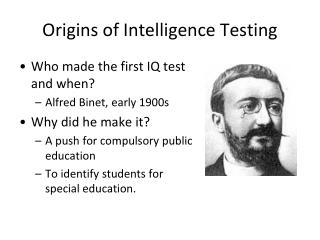
The Binet-Simon Scale • Binet-Simon Scale: The “FIRST” intelligence test. Alfred Binet was commissioned by the French Government to identify children with special learning needs • Binet developed the concept of “Mental Age” • mental age: a child who scored the same as the “average” child of a given age on a standardized test had that “mental age” • example: if a 10 year old scored the same as the average 12 year old, he had a mental age of 12
The Stanford-Binet • Louis M. Terman: working at Stanford University, developed an “English” version of the Binet-Simon • Longitudinal Study: Termanalso began a long-term study of “gifted” children • Intelligence Quotient (IQ): credited to Terman. Expesses the relationship between “mental age” and “chronological age” as a single number (a “quotient”) • IQ = mental age/chronological age * 100
Examples of IQ Computation • a ten year old: scores at the level of the average 12 year old on a given test • 12/10 * 100 = 120 (a bright 10 year old) • a ten year old: scores at the level of the average 8 year old on a given test • 8/10 * 100 = 80 (a below average 10 year old)
The Stanford-Binet yields an overall IQ plus four “area” IQs • 1. verbal reasoning • 2. abstract/visual reasoning • 3. quantitative reasoning • 4. short-term memory The Stanford-Binet overall IQ and area IQs have a mean of 100 and standard deviation of 15
David Wechsler’s Contribution • Wechsler noted that the Stanford-Binet was designed primarily for “children” • Weshsler developed a test for adults (the WAIS) Wechsler Adult Intelligence Scale • The WAIS yields an overall IQ plus two “area” IQs: “verbal” and “performance” • Like the Stanford-Binet, the WAIS overall IQ and area IQs have a mean of 100 and standard deviation of 15
Wechsler Extends His Work • Wechsler developed a test for (1) older children and adolescents (WISC) Wechsler Intelligence Scale for Children and (2) young children (WPPSI) Wechsler Preschool/Primary Scales of Intelligence • Because each test covers a narrow age range and is easier to use, the Wechsler scales have surpassed the Stanford-Binet as the most widely used IQ tests
Test Administration • The Stanford-Binet, Wechsler Scales, and other IQ test are administered individually (one examiner to one test taker). One takes about 90 minutes. • The testing process can be lengthy and tiring for examiner and test taker • There are group (pencil and paper) IQ tests which are less accurate
What does an IQ score mean?(See Appendix A in book) • To answer this we need to know a little bit about “STATISTICS” • Statistics: branch of mathematics used to organize and analyze data • 3 important statistical concepts • measures of central tendency • measures of variability • the “normal” or “bell” curve
Three Measures of Central Tendency • 1. Mode: the most frequently occurring score (2,3,5,2,4,6) the mode is “2” • 2. Median: score that divides the distribution of scores in half (2,4,5,8,9) the median is “5” • 3. Mean: the arithmetic average (2+3+5+6) / 4 = “4”
Two Measures of Variability • 1. Range: difference between the highest and lowest scores in a distribution (2,5,3,9,7) the range is 9 -2 = “7” • 2. Standard Deviation: a more useful measure “the average distance that a group of scores are from their mean” • 7 scores (85, 90, 95, 100, 105, 110, 115) What is the average distance that these scores are from their mean (100)?
Computing the standard deviation 85 - 100 = -15 (-15)2 = 225 90 - 100 = -10 (-10)2 = 100 95 - 100 = - 5 (-5)2 = 25 100 -100 = 0 (0)2 = 0 105 -100 = 5 (5)2 = 25 110 -100 = 10 (10)2 = 100 115 -100 = 15 (15)2 = 225 = 700 700 / 7 = 100 100 = 10 The standard deviation is “10”
The “Normal” Distribution (“Bell Curve”) • Is a “hypothetical” bell shaped curve that approximates the distribution of scores (characteristics) found among most “naturally occurring” variables • “some naturally occurring variables are height, weight, personality traits, and “IQ”! • The normal distribution is “marked off” in “standard deviations” with 0 at the center • IN the next slide, the percentages for each part of the curve are shown. Note, they add up to 100%
The “Normal” Distribution (“Bell Curve”)marked off in “standard deviations” (SD) • Intelligence is a “naturally occurring variable.” IQ is, therefore, “normally distributed.” recall,Mean = 100, SD = 15 • So, for all people in the U.S. (or any other) population: • 68 % have IQs between + and - 1 SD (85 - 115) • 95 % have IQs between + and - 2 SD (70 - 130) 2.5% 13.5% 34% 34% 13.5% 2.5% -2 -1 0 +1 +2 < SD 70 85 100 115 130 < IQ
a more complete distribution of IQ scores going out to about + and - 4 standard deviations
Performance and Culture-Fair Tests • performance tests: Intelligence tests that minimize the use of language. • culture-fair tests: Intelligence tests that eliminate “cultural bias” by minimizing skills and values that vary from one culture to another (e.g., what to do if another child hits you?) Children of different “Social Classes would answer differently. • Progressive Matrices:an example of a test that is both a performance test and a culture-fair test
What Makes a Good Test: Psychometrics • 1. reliability: Ability of a test to produce consistent and stable scores. • 2. validity: Extent to which the test measures what we think it measures. • correlation: Statistical measures of the strength and direction of the relationship between two variables. Correlation ranges from -1 to + 1 • Both reliability and validity are established via correlations
Reliability • Five people take the same test twice on Monday and again on Friday person Monday Score Friday Score A 100 80 B 140 90 C 75 120 D 80 130 E 150 90 • Correlation is “low” Reliability is “poor”
Reliability • Five people take the same test twice on Monday and again on Friday person Monday Score Friday Score A 100 102 B 140 138 C 75 72 D 80 79 E 150 155 • Correlation is “high” Reliability is “good”
Reliability • carry over effects: can occur when the first administration of a test influences the score on a second testing. • split-half reliability: A method of determining test reliability by dividing a test into two halves and correlating the two halves. Eliminates carry over effects.
Establishing Validity of a New Test • Five people complete our “new IQ test” and an “established test” (e.g., Stanford-Binet) person New Test Established Test A 70 102 B 140 90 C 75 135 D 80 122 E 150 75 • Correlation is “low” Validity is “poor”
Establishing Validity of a New Test • Five people complete our “new IQ test” and an “established test” (e.g., Stanford-Binet) person New Test Established Test A 100 102 B 140 138 C 75 72 D 80 79 E 150 155 • Correlation is “high” Validity is “good”
Types of Validity • content validity: extent to which a test contains questions that cover “all” aspects of the subject being tested • criterion validity: the new test is compared to a “criterion” or “standard” to establish its validity • face validity: what the questions are measuring is very obvious (e.g., Are you depressed?). Sometimes a problem in personality, attitude, or clinical testing
Positive Aspects of Individual Testing • problems (lack of motivation) can be detected • tests can be tailored for those with special needs • tests are quite accurate and reliable Criticisms of Individual Testing • possibility of “Halo Effect” (a positive or negative bias on the part of the examiner) • tests are time consuming and expensive • tests can give an unfair advantage to those of higher SES in school placement situations • tests may contain cultural-ethnic biases
Heredity Tryon’s maze bright and maze dull rats IQ correlations in humans Environment Tryon’s and Rosenzweig’s rat studies H. M. Skeels study of mentally retarded orphans What Determines Intelligence?(Nature vs. Nurture)
Evidence for Heredity • Robert Tryon taught rats to run a maze • He bred the fastest learners with other fast learners over several generations • He did the same with the slowest learners • After several generations, he had two distinct populations: “maze bright rats” who learned quickly and “maze dull rats” who learned slowly
Evidence for Environment • Research by both Robert Tryon and Mark Rosenszweig showed that rats raised in a “stimulating” environment had more well developed brains and were brighter than rats raised in a plain and boring environment
Evidence for Environment • H. M. Skeels studied two groups of below average IQ orphans • One group was placed in a setting where they had “attention” from adult patients (also below average IQ) • The other group remained in the orphanage, receiving little attention • IQ scores INCREASED for the group placed with the adults
The Flynn Effect • Professor James Flynn: has noted that IQ scores worldwide have been increasing several points per decade since the 1930s • However, nobody, as yet, is sure exactly why. • Are we getting more intelligent, and if so why? • Maybe just getting better at taking tests.
Gender Differences in Intelligence • Recent research finds little difference in the math and verbal abilities of males and females. • Males do have better spatial ability than females. • The average male and female IQ is about the same, but there is a higher proportion of men at the two extremes.
Extremes of Intelligence • mental retardation: The condition of significantly subaverage intelligence (IQ below 70) combined with deficiencies in adaptive behavior. • giftedness: Refers to superior IQ combined with demonstrated or potential ability in such areas as academic aptitude, creativity, and leadership.
Levels of Mental Retardation Mild - 50 through 70 may be able to function independently Moderate > 35 through 50 will need some level of care and supervision Severe > 20 through 35 will need extensive care and supervision Profound > 0 through 20 incapable of the even the simplest tasks
Some Genetic Causes of Retardation • Down syndrome: results from an “extra” defective 21st chromosome (also called “Trisomy 21”). • phenylketonuria (PKU): An enzyme needed for metabolizing certain foods is absent. Toxins collect and damage the nervous system • fragile-X syndrome: due to a defect on the X chromosome
Other Causes of Retardation • alcohol or other drugs during pregnancy • exposure to toxins or radiation during pregnancy • maternal illness during pregnancy • birth trauma • malnutrition/deprivation during childhood • numerous other causes
Creativity • The ability to produce novel and socially valued ideas or objects. • Creativity differs from giftedness • One can be very creative without having superior intelligence