Download
1 / 20
240 likes | 459 Views
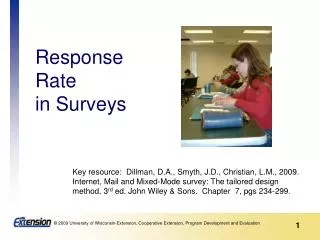
Response Rate in Surveys. Key resource: Dillman, D.A., Smyth, J.D., Christian, L.M., 2009. Internet, Mail and Mixed-Mode survey: The tailored design method, 3 rd ed. John Wiley & Sons. Chapter 7, pgs 234-299. Check your understanding of response rate .

E N D
Response Rate in Surveys Key resource: Dillman, D.A., Smyth, J.D., Christian, L.M., 2009. Internet, Mail and Mixed-Mode survey: The tailored design method, 3rd ed. John Wiley & Sons. Chapter 7, pgs 234-299.
Check your understanding of response rate Select agree or disagree for each item: Check answers on next slide
Response rate is… The proportion of people who return the survey questionnaire. It is calculated by dividing the number of returned surveys by the total number of surveys distributed. Example: If you distribute 250 questionnaires and you get 85 questionnaires back, your response rate is 34%. # that answered # you contacted
Low response to our surveys We often send out surveys and find that few are returned. Response rates of 30% and lower are common in Extension. Often, the number of returned surveys is too small to aggregate in a meaningful way or make any comparisons. Best practice says that a response rate under 70% should be a warning.
Why is response rate important? • High response rate promotes confidence in results. • Low response rate increases the likelihood of biased results. It’s the only way to know if your survey results are representative.
“The higher, the better.” While it is not actually the % that matters but WHO responds, a higher response rate means that you can be more sure that the answers reflect the population. So, we want to remove barriers and motivate as many people as possible to complete and return the questionnaire. How can we do that? There is no standard response rate
Most important things that influence response rate: • Salience of the topic – interest in the topic of the survey • Personalized request and communications • Multiple follow-up contacts • Sponsor of the survey is respected, trusted • Questionnaire is concise and easy to complete
10 Ways to increase response rate Generate positive publicity for your survey. Appeal to people’s helping tendencies – ask them to help by providing their input. Make the survey topic salient – important Ensure that respondents see the value of the survey and their response. Point out their personal connection to the topic Tailor, personalize communications Make the questionnaire attractive and easy to complete AND easy to return
10 ways to increase response rate, cont. • Provide incentives (token of appreciation) • Show positive regard; Say thank you • For mail survey, provide 1st class postage/return postage • Make (multiple) follow-up contacts– by mail, email, telephone, in person… • Use a combination of survey modes – telephone plus mail; internet plus mail.
Personalize communications Purpose: to motivate people to answer; appeal to their helping tendencies • Use name, if appropriate and possible • Personalize the importance of the survey to the respondent • For mail surveys, use of letterhead printed on quality paper • Use recognizable logos and graphics • Personalize salutations as appropriate
Incentives In Extension, we may be limited to what we can offer as incentives, but research shows that incentives do increase response rates. Prepaid incentives work better than promising something if the questionnaire is returned. Incentives can be cash ($1 as smallest amount) or nonmonetary, e.g., a tea bag inserted with a mail questionnaire; a gift card; state park or movie pass; etc. Or, a lottery, raffle, or prize drawing (e.g., offer to put names of all completed and return questionnaires into a ‘raffle’ for a $50 gift certificate to the area’s best restaurant); or, offer to donate $1 for every questionnaire submitted to the local food pantry.
Multiple contacts • Consider 3-5 contacts • Brief pre-notification • Questionnaire mailing with cover letter • Thank you follow-up (post card) • Reminder with replacement questionnaire • Final contact • More important than number of contacts is that each has a different look and appeal • Strategically time all contacts • Use different modes of contact • different ways of contacting people (email, mail, individual) • different delivery of the questionnaire (url, email attachment, postal mail, in-person)
“Failure to follow up with nonrespondents can ruin an otherwise well-designed survey”
Response rate may be affected by how the survey is distributed. In Zoomerang, there are two options: • Use email addresses. you need individual names with current email addresses. Send invitation plus other communications - reminders, track respondents, and receive detailed deployment information. • This is the only option that allows you to calculate the response rate • Post the url in a public place – when you don’t have individual addresses. E.g., in newsletter, on web site, bulletin board; or send to an email list (not individual addresses). • You may not know who sees/received the url – you do not know the total number of people who received the questionnaire.
Address low response • Determine how people who responded are different from those who didn’t respond. • Describe your results in terms of who did respond. Don’t imply that the results apply to anyone other than those who responded.
When response rate is low… Use language that is suggestive rather than decisive. Examples: “The data suggests” vs. “The data prove”; “It appears” vs. “It shows” Don’t generalize findings to the entire group. Indicate who responded, i.e., who the data represents.
When response rate is low… Use a summary statement such as: The response rate was only 45% so care should be taken when reviewing these results. The results should be applied to those who responded, not all participants.
How would you rate your understanding: Now after reviewing these slides to Before you started? NOW • Very poor • Poor • Fair • Good • Very good BEFORE • Very poor • Poor • Fair • Good • Very good
Good luck with working to improve the response rate on your next survey!