Download
1 / 5
50 likes | 54 Views
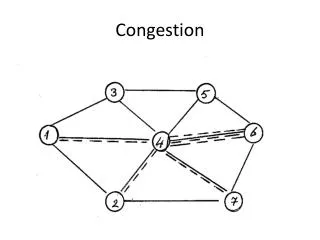
This example from Jeff Billo in November 2011 explores the relationship between congestion cost and potential production cost savings in ERCOT's economic planning. It highlights the importance of measuring and understanding congestion to identify system inefficiencies.

E N D
Congestion Cost Example Jeff Billo, ERCOT Mid-Term Planning ROS, November 2011
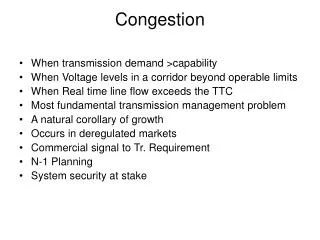
ERCOT Economic Planning • Current ERCOT economic planning criteria uses a reduction in production costs or a reduction in energy revenue to justify transmission improvements • Ideally, when observing past congestion we would measure the production cost or energy revenue impact due to each transmission constraint • However, this is not practical using existing tools
Example $10/MW $40/MW A B Rating = 80 MW ~ ~ 100 MW LMP A = $10/MWh LMP B = $40/MWh Load Charge = $40 X 100 MW = $4000 Generator A Payment = $10 X 80 MW = $800 Generator B Payment = $40 X 20 MW = $800 Total Congestion Cost = $4000 -$800 -$800 = $2400 Shadow Price = $40 - $10 = $30 Congestion cost = Shadow price X Rating = $30 X 80 = $2400 Production cost = $800 + $800 = $1600 Q: Where does the $2400 go? A: In an ideal market, it goes back to load
What is the value of upgrading the line? Rating = 200 MW $10/MW $40/MW A B Rating = 80 MW ~ ~ 100 MW LMP A = $10/MWh LMP B = $10/MWh (the constraint is not binding) Load Charge = $10 X 100 MW = $1000 Generator A Payment = $10 X 100 MW = $1000 Generator B Payment = $10 X 0 MW = $0 Total Congestion Cost = $1000 -$1000 -$0 = $0 Shadow Price = $0 Congestion cost = Shadow price X Rating = $0 X 200 = $0 Production cost = $1000 + $0 =$1000 Production cost savings = $1600 - $1000 = $600
Conclusions • Congestion cost is not the same as potential production cost savings or energy revenue savings • Congestion cost (rent) is a good metric for measuring where there is congestion, and hence inefficiencies on the system • And can give a sense of magnitude of congestion • Questions?