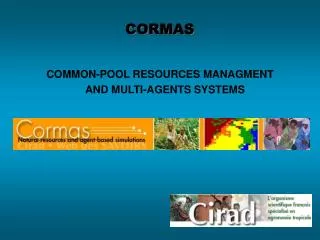
Integrating a personnalized user-interface in a CORMAS model
140 likes | 271 Views
Integrating a personnalized user-interface in a CORMAS model. 1. Prepare the data to be visualized Example: structure in classes of annual age of the population of blue cephalophes in the Djemiong model.

Integrating a personnalized user-interface in a CORMAS model
E N D
Presentation Transcript
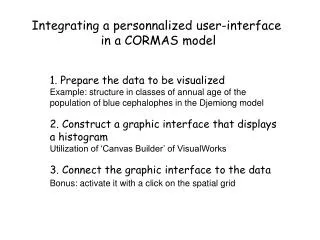
Integrating a personnalized user-interface in a CORMAS model 1. Prepare the data to be visualizedExample: structure in classes of annual age of the population of blue cephalophes in the Djemiong model 2. Construct a graphic interface that displaysa histogramUtilization of ‘Canvas Builder’ of VisualWorks 3. Connect the graphic interface to the dataBonus: activate it with a click on the spatial grid
1. Prepare the data to be visualized In the Djemiong model, the class Duiker is characterizedby an attribute age, expressed in weeks. Initially, the age is attributed by chance between 0 and 80. At each time step, by the activation of the methodgrowth, each instance of Duiker sees the value of itsattribute age augmented by 1. At each time step, by the activation of the methodmortality, each instance of Duiker is subjected to a probability to die. This probability is high for the youngsters, mild for the adults, and becomes very high when the age corresponding to the life expectancy (7 years) is reached. The objective is to calculate the proportions of each 7 annual age group (the last being the class 7+ )
1. (continued) Write the method Djemiong>>duikersYearlyClasses At the level of the Cormas model Djemiong, the collection of instances of Duiker are called theDuikers. duikersYearlyClasses | nbYearClassesyearlyClassesyearClass | nbYearClasses := 7. yearlyClasses := Array new: nbYearClasses withAll: 0. self theDuikers do: [:aDuiker | yearClass := nbYearClasses min: (aDuiker age quo: 52) + 1. yearlyClasses at: yearClass put: (yearlyClasses at: yearClass) + 1]. yearlyClasses := yearlyClasses collect: [:anInteger | (anInteger / self theDuikers size) asFloat]. ^yearlyClasses
2. Construct a graphic interfacethat displays a histogram Open the ‘canvas builder’ from VisualWorks
2.2 Place an element of type ‘Chart’on the canvas « Drag & drop »
2.4 Create (‘install’) the class from the interface Click on the icon ‘install’
2.4 (continued) Open the assistant for the creation Complete the fields
2.4 (end) Name the resource Validate
3.1 Add an attribute cormasModelto the class Interfaces Do not forget the accessor methods !!!
3.2 Write the method linking to the data 1. Create a new protocol ‘data’ 2. Write the method that establishes the link with the data