Download
1 / 37
370 likes | 391 Views
Explore the groundbreaking field of genomics and gain insights into the structure of DNA, gene expression, and the tools used to study the genome. Discover the significant contributions made by researchers like Watson and Crick in deciphering the genetic code.

E N D
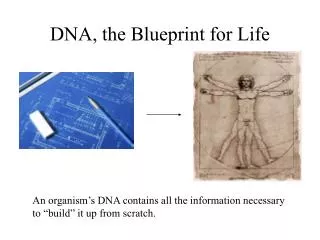
Genomics: Understanding the Blueprint of Life Sujay Datta Statistical Center for HIV/AIDS Research & Prevention (Vaccines & Infectious Diseases Institute) Fred Hutchinson Cancer Research Center
Genes: The Unit of Inheritance Figure 10.1
The person who made a silent contribution to this great discovery
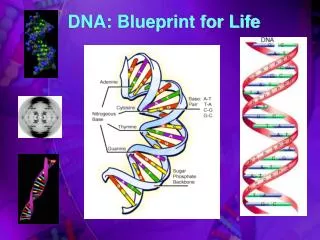
The Double Helix Figure 10.10a & b
Watson-Crick Base Pairs Figure 10.10a & b
“It has not escaped our notice that the specific pairing we have postulated immediately suggests a possible copying mechanism for the genetic material.” Watson and Crick, Nature 171, 737-738 (1953)
Information Flow in the Cell Figure 11.2
Genes can be expressed at different levels in different tissues or organisms
Intervening Sequences Figure 11.23
RNA splicing removes introns from the pre-mRNA and converts it to mRNA Figure 11.23
Translation of spliced mRNAs to proteins occurs at the ribosomes
The Genetic Code Figure 11.41
Measuring gene expression • So the expression levels of genes in different tissues, organs or individuals can be measured by quantifying the amounts of mRNAs they produce. The totality of all mRNAs produced from an organism’s genome is its transcriptome • Expression levels of genes in different tissues, organs or individuals can also be measured by measuring the amounts of proteins they code for(the totality of all proteins coded for by an organism’s genome is its proteome) • The 1st method is a bit indirect but more manageable, as the proteome is much larger than the transcriptome
Microarrays: A revolution in gene expression profiling • Until the 1990s, could only measure the expression levels of a few genes at a time---at great expenses • In came microarrays that, for the first time, enabled us to measure the expression of thousands of genes at once (the current versions of them can handle entire genomes) • Types of microarrays: Short oligo- nucleotide (Affymetrix), long oligo-nucleotide (Agilent), nylon bead arrays (Illumina), cDNA arrays • Other technologies: SAGE, MPSS
Custom software: getting representative value of a probe cell
Data: log_2 (fluorescence intensity) Which genes are significantly differentially expressed between 2 individuals or conditions (at a particular time-instant)? Which genes show significant changes in expression over time? Which genes have expression levels that are correlated with some external variable? For a given pathway, which of the genes in our collection are most likely to be involved? For a diffuse disease, which genes are associated with different outcomes? Problems: Many sources of noise and variation Spatial artifacts due to manufacturing defects Contamination by RNA and other substances from unwanted sources Batch-to-batch variation Experimenter-to-experi- menter variation Day-to-day variation Problem: Cost. They have become cheaper over the years. Still difficult to afford > 250-300 Microarray data: Promises & Problems
preprocessing of the images normalization of the data from the images Probe-level modeling to extract expression level data gene-filtering clustering relating to biologic data from other sources such as a pathway database or an annotation database Need replicates of each gene-individual combination to ensure a good estimate of the random error (i.e., the variation that still remains after getting rid of all known sources of variation) Need good models to take into account all systematic sources of variation Avoid confounding between the different experimental conditions (treatment/control or cancer/normal) with the systematic sources of var. Steps to extract meaningful information from microarrays
Steps in image analysis 1. Addressing. Estimate location of spot centers. 2. Segmentation. Classify pixels as foreground (signal) or background. • 3. Information extraction. For • each spot on the array and each • dye • signal intensities; • background intensities; • quality measures.
Segmentation Adaptive segmentation, SRG Fixed circle segmentation Spots usually vary in size and shape.
Normalization is needed to minimize non-biological variation between arrays. It basically means an ‘intensity alignment’ between arrays
Probe-level model for the normalized and background-corrected data • The LHS is the normalized log expression value for the i-th probe, j-th array, k-th dye (in the case of a 2-color array) and l-th replicate. • The fit from this model is the final summary out-put of the preprocessing steps. It is a huge matrix and is called an expression-set
Finding “interesting” genes • Now, for each array, we have obtained expression-level data as columns of a huge matrix (expression-set) • The next step is to select those genes that have “interesting” expression levels. • “Interesting” is interpreted in many different ways: • high levels of expression in a subgroup of interest • lack of expression in a subgroup of interest • pattern of expression that correlates well with experimental conditions or certain covariates • pattern of expression that correlates well with time
Methods to detect “interesting” genes • Fold-changes – ratio of expression levels between two groups (biologists are most comfortable with it) • t-tests – now statistical variation comes in to play • Other statistical models: ANOVA, Cox Model, etc. • For large enough samples we can tailor the test to the distribution (which may be different in the 2 groups) • Whenever inference is being drawn about many, many genes simultaneously, a multiplicity adjustment to the p-values must be made
Why need multiplicity-adjusted tests? • Let A,B and C be events with P(A)=a, P(B)=b, P(C)= c. Then P(A* and B* and C*) >= 1-[P(A)+P(B)+P(C)], where A*, B* and C* are the complements of A,B,C • If we are testing 3 hypotheses, each at level .05, let A={type-I error is made in hypo. #1}, B={type-I error made in hypo. # 2}, C={type I error made in hypo# 3} • Then all we can say is: P(All 3 decisions are correct) is at least 1-(.05+.05+.05) or .85 (i.e., the chances of at least one type-I error can be as high as 15%) • Now imagine testing 5000 or 10000 hypotheses! • That’s why the cut-off values for the tests should be adjusted so that P(1 or more type-I error) <= .05
Filtering genes • A filter is a mechanism for removing a gene from further consideration • Want to reduce the number of genes under consideration so that we can concentrate on those that are more interesting (it is a waste of resources to study genes that are not likely to be of interest) Non-specific filtering: • at least k (or a proportion p) of the samples must have expression values larger than some specified amount, A. • the gene should show sufficient variation to be interesting: • either a gap of size A in the central portion of the data • or a interquartile range of at least B
Gene-set enrichment analysis • Suppose you have a short-list of genes that have significant p-values from a statistical test (say, for differential expression or temporalchange in profile) • Now you want to see if a given set of genes (that are known to be of interest to biologists or belong to a crucial pathway, etc.) is over-represented in this list • Ex: In a list of ~ 5000 significantly differentially ex- pressed genes between acutely HIV-infected and healthy individuals, are the NK-cell KIR genes over-represented (compared to those not diff. exp.)? • 2X2 contingency table (diff. exp. or not, NK-cell KIR or not) • Fisher’s exact test (or hypergeometric test)