Download
1 / 56
560 likes | 720 Views
Economics 202 Principles Of Macroeconomics. Supplemental Notes to Monetary Policy The Federal Reserve System Controlling the Quantity of Money Modeling Money: The Money Market. The Federal Reserve System. The Federal Reserve System , or the Fed, is the central bank of the United States.

E N D
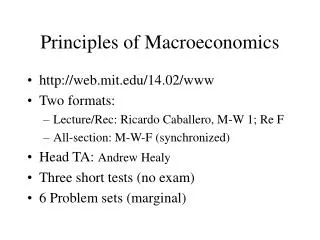
Economics 202Principles Of Macroeconomics • Supplemental Notes to Monetary Policy • The Federal Reserve System • Controlling the Quantity of Money • Modeling Money: The Money Market
The Federal Reserve System • The Federal Reserve System, or the Fed, is the central bank of the United States. • A central bank is the public authority that regulates a nation’s depository institutions and controls the quantity of money. Note: These lecture notes are incomplete without having attended lectures
The Fed’s Goals and Targets • The Fed conducts the nation’s monetary policy, which means that it adjusts the quantity of money in circulation. • The Fed’s goals are to keep inflation in check, maintain full employment, moderate the business cycle, and contribute to achieving long-term growth. • In pursuit of its goals, the Fed pays close attention to interest rates and sets a target that is consistent with its goals for the federal funds rate, which is the interest rate that the banks charge each other on overnight loans of reserves. Note: These lecture notes are incomplete without having attended lectures
The Structure of the Fed • The key elements in the structure of the Fed are: • The Board of Governors • The regional Federal Reserve banks • The Federal Open Market Committee. Note: These lecture notes are incomplete without having attended lectures
The Federal Reserve System • The Board of Governors has seven members appointed by the president of the United States and confirmed by the Senate. • Board terms are for 14 years and overlap so that one position becomes vacant every 2 years. • The president appoints one member to a (renewable) four-year term as chairman. • Each of the 12 Federal Reserve Regional Banks has a nine-person board of directors and a president. Note: These lecture notes are incomplete without having attended lectures
The Federal Reserve System Figure 1 shows the regions of the Federal Reserve System. Note: These lecture notes are incomplete without having attended lectures
The Federal Reserve System • The Federal Open Market Committee (FOMC) is the main policy-making group in the Federal Reserve System. • It consists of the members of the Board of Governors, the president of the Federal Reserve Bank of New York, and the 11 presidents of other regional Federal Reserve banks of whom, on a rotating basis, 4 are voting members. • The FOMC meets every six weeks to formulate monetary policy. Note: These lecture notes are incomplete without having attended lectures
The Federal Reserve System • The Fed’s Power Center • In practice, the chairman of the Board of Governors (since 1987 Alan Greenspan) is the center of power in the Fed. • He controls the agenda of the Board, has better contact with the Fed’s staff, and is the Fed’s spokesperson and point of contact with the federal government and with foreign central banks and governments. Note: These lecture notes are incomplete without having attended lectures
The Fed’s Policy Tools • The Fed uses three monetary policy tools: • Required reserve ratios • The discount rate • Open market operations Note: These lecture notes are incomplete without having attended lectures
Elects six directors to each FRB Appoints three directors to each FRB Select Federal Reserve system Reviews and Determines Establish Directs Sets (within limits) Policy Tools Formal Structure of the Federal Reserve Twelve Federal Reserve Banks (FRBs) Each of the nine directors who appoint president and other officers of the FRB Board of Governors Seven members appointed by the president of the United States and confirmed by the Senate Around 4800 member commercial banks Federal Open Market Committee (FOMC) Seven members of Board of Governors plus presidents of FRB of NY and four other FRBs. Federal Advisory Council Twelve Members (bankers) Reserve Requirements Open Market Operations Discount Rate Note: These lecture notes are incomplete without having attended lectures
The Federal Reserve System • The Fed sets required reserve ratios, which are the minimum percentages of deposits that depository institutions must hold as reserves. • The Fed does not change these ratios very often. • The discount rate is the interest rate at which the Fed stands ready to lend reserves to depository institutions. • An open market operation is the purchase or sale of government securities—U.S. Treasury bills and bonds—by the Federal Reserve System in the open market. Note: These lecture notes are incomplete without having attended lectures
The Fed’s Balance Sheet • On the Fed’s balance sheet, the largest and most important asset is U.S. government securities. • The most important liabilities are Federal Reserve notes in circulation and banks’ deposits. • The sum of Federal Reserve notes, coins, and banks’ deposits at the Fed is the monetary base. Note: These lecture notes are incomplete without having attended lectures
Controlling the Quantity of Money • How Required Reserve Ratios Work • An increase in the required reserve ratio boosts the reserves that banks must hold, decreases their lending, and decreases the quantity of money. • How the Discount Rate Works • An increase in the discount rate raises the cost of borrowing reserves from the Fed and decreases banks’ reserves, which decreases their lending and decreases the quantity of money. Note: These lecture notes are incomplete without having attended lectures
Controlling the Quantity of Money • How an Open Market Operation Works • When the Fed conducts an open market operation by buying a government security, it increases banks’ reserves. • Banks loan the excess reserves. • By making loans, they create money. • The reverse occurs when the Fed sells a government security. Note: These lecture notes are incomplete without having attended lectures
Controlling the Quantity of Money • Although the details differ, the ultimate process of how an open market operation changes the money supply is the same regardless of whether the Fed conducts its transactions with a commercial bank or a member of the public. • An open market operation that increases banks’ reserves also increases the monetary base. Note: These lecture notes are incomplete without having attended lectures
Controlling theQuantity of Money Figure 3 illustrates both types of open market operation. Note: These lecture notes are incomplete without having attended lectures
Bank Reserves, the Monetary Base, and the Money Multiplier • The money multiplier is the amount by which a change in the monetary base is multiplied to calculate the final change in the money supply. • An increase in currency held outside the banks is called a currency drain. • Such a drain reduces the amount of banks’ reserves, thereby decreasing the amount that banks can loan and reducing the money multiplier. Note: These lecture notes are incomplete without having attended lectures
Controlling the Quantity of Money • The money multiplier differs from the deposit multiplier. • The deposit multiplier shows how much a change in reserves affects deposits. • The money multiplier shows how much a change in the monetary base affects the money supply. Note: These lecture notes are incomplete without having attended lectures
The Multiplier Effect of an Open Market Operation • When the Fed conducts an open market operation, the ultimate change in the money supply is larger than the initiating open market operation. • Banks use excess reserves from the open market operation to make loans so that the banks where the loans are deposited acquire excess reserves which they, in turn, then loan. Note: These lecture notes are incomplete without having attended lectures
Controlling the Quantity of Money Figure 4 illustrates a round in the multiplier process following an open market operation. Note: These lecture notes are incomplete without having attended lectures
Controlling the Quantity of Money Figure 5 illustrates the multiplier effect of an open market operation. Note: These lecture notes are incomplete without having attended lectures
The Demand for Money The Influences on Money Holding • The quantity of money that people plan to hold depends on four main factors: • The price level • The interest rate • Real GDP • Financial innovation Note: These lecture notes are incomplete without having attended lectures
The Demand for Money: Price Level • A rise in the price level increases the nominal quantity of money but doesn’t change the real quantity of money that people plan to hold. • Nominal money is the amount of money measured in dollars. • The quantity of nominal money demanded is proportional to the price level — a 10 percent rise in the price level increases the quantity of nominal money demanded by 10 percent. Note: These lecture notes are incomplete without having attended lectures
The Demand for Money: Interest Rate • The Interest Rate • The interest rate is the opportunity cost of holding wealth in the form of money rather than an interest-bearing asset. • A rise in the interest rate decreases the quantity of money that people plan to hold. • Real GDP • An increase in real GDP increases the volume of expenditure, which increases the quantity of real money that people plan to hold. Note: These lecture notes are incomplete without having attended lectures
The Demand for Money • Financial innovation • Financial innovation that lowers the cost of switching between money and interest-bearing assets decreases the quantity of money that people plan to hold. Note: These lecture notes are incomplete without having attended lectures
The Demand for Money Curve • The demand for money curve is the relationship between the quantity of real money demanded (M/P) and the interest rate when all other influences on the amount of money that people wish to hold remain the same. Note: These lecture notes are incomplete without having attended lectures
The Demand for Money • Figure 6 illustrates the demand for money curve. • The demand for money curve slopes downward—a rise in the interest rate raises the opportunity cost of holding money and brings a decrease in the quantity of money demanded, which is shown by a movement along the demand for money curve. Note: These lecture notes are incomplete without having attended lectures
Shifts in the Demand for Money Curve • The demand for money changes and the demand for money curve shifts if real GDP changes or if financial innovation occurs. Note: These lecture notes are incomplete without having attended lectures
The Demand for Money Figure 7 illustrates an increase and a decrease in the demand for money. A decrease in real GDP or a financial innovation decreases the demand for money and shifts the demand curve leftward. An increase in real GDP increases the demand for money and shifts the demand curve rightward. Note: These lecture notes are incomplete without having attended lectures
The Demand for Money in the United States Figure 8 shows scatter diagrams of the interest rate against real M1 and real M2 from 1971 through 2001 and interprets the data in terms of movements along and shifts in the demand for money curves. Note: These lecture notes are incomplete without having attended lectures
The Demand for Money in the United States Figure 8 shows scatter diagrams of the interest rate against real M1 and real M2 from 1971 through 2001 and interprets the data in terms of movements along and shifts in the demand for money curves. Note: These lecture notes are incomplete without having attended lectures
Interest Rate Determination • An interest rate is the percentage yield on a financial security such as a bond or a stock. • The price of a bond and the interest rate are inversely related. • If the price of a bond falls, the interest rate on the bond rises. • If the price of a bond rises, the interest rate on the bond falls. • We can study the forces that determine the interest rate in the market for money. Note: These lecture notes are incomplete without having attended lectures
Money Market Equilibrium • The Fed determines the quantity of money supplied and on any given day, that quantity is fixed. • The supply of money curve is vertical at the given quantity of money supplied. • Money market equilibrium determines the interest rate. Note: These lecture notes are incomplete without having attended lectures
Interest Rate Determination Figure 9 illustrates the equilibrium interest rate. Note: These lecture notes are incomplete without having attended lectures
Interest Rate Determination • If the interest rate is above the equilibrium interest rate, the quantity of money that people are willing to hold is less than the quantity supplied. • They try to get rid of their “excess” money by buying financial assets. • This action raises the price of these assets and lowers the interest rate. Note: These lecture notes are incomplete without having attended lectures
Interest Rate Determination • If the interest rate is below the equilibrium interest rate, the quantity of money that people want to hold exceeds the quantity supplied. • They try to get more money by selling financial assets. • This action lowers the price of these assets and raises the interest rate. Note: These lecture notes are incomplete without having attended lectures
Changing the Interest Rate • Figure 10 shows how the Fed changes the interest rate. • If the Fed conducts an open market sale, the money supply decreases, the money supply curve shifts leftward, and the interest rate rises. Note: These lecture notes are incomplete without having attended lectures
Interest Rate Determination If the Fed conducts an open market purchase, the money supply increases, the money supply curve shifts rightward, and the interest rate falls. Note: These lecture notes are incomplete without having attended lectures
Ripple Effects of Monetary Policy • If the Fed increases the interest rate, three events follow: • Investment and consumption expenditures decrease. • The dollar rises and net exports decrease. • A multiplier process unfolds. Note: These lecture notes are incomplete without having attended lectures
Monetary Policy, Real GDP,and the Price Level Figure 11 summarizes these ripple effects. Note: These lecture notes are incomplete without having attended lectures
Monetary Policy in the AS-AD Model Figure 12 illustrates the attempt to avoid inflation. Note: These lecture notes are incomplete without having attended lectures
Monetary Policy, Real GDP,and the Price Level A decrease in the money supply in part (a) raises the interest rate. Note: These lecture notes are incomplete without having attended lectures
Monetary Policy, Real GDP,and the Price Level The rise in the interest rate decreases investment in part (b). Note: These lecture notes are incomplete without having attended lectures
Monetary Policy, Real GDP,and the Price Level The decrease in investment shifts the AD curve leftward with a multiplier effect in part (c). Note: These lecture notes are incomplete without having attended lectures
Monetary Policy, Real GDP,and the Price Level Real GDP decreases and the price level falls. Note: These lecture notes are incomplete without having attended lectures
Monetary Policy, Real GDP,and the Price Level Figure 13 illustrates the attempt to avoid recession. Note: These lecture notes are incomplete without having attended lectures
Monetary Policy, Real GDP,and the Price Level An increase in the money supply in part (a) lowers the interest rate. Note: These lecture notes are incomplete without having attended lectures
Monetary Policy, Real GDP,and the Price Level The fall in the interest rate increases investment in part (b). Note: These lecture notes are incomplete without having attended lectures
Monetary Policy, Real GDP,and the Price Level The increase in investment shifts the AD curve rightward with a multiplier effect in part (c). Note: These lecture notes are incomplete without having attended lectures
Monetary Policy, Real GDP,and the Price Level Real GDP increases and the price level rises. Note: These lecture notes are incomplete without having attended lectures