Download
1 / 2
0 likes | 7 Views
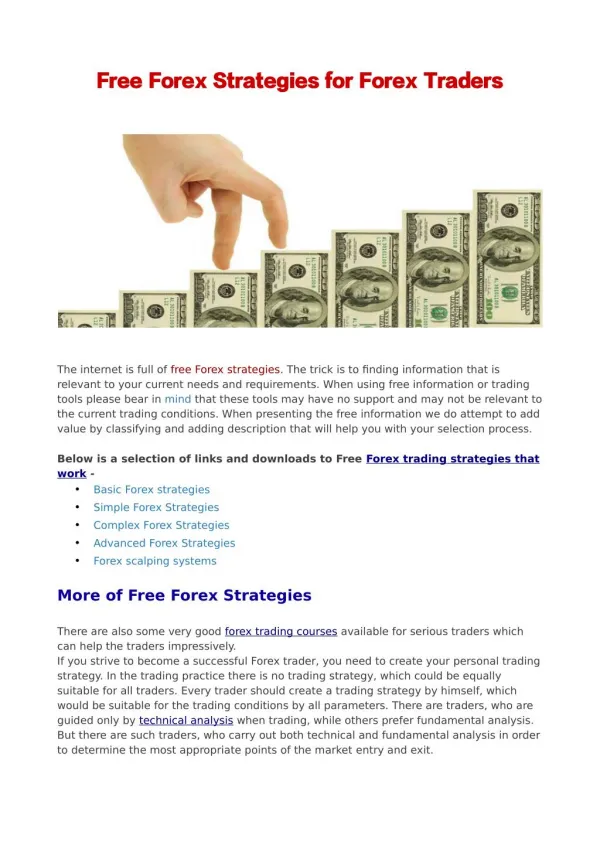
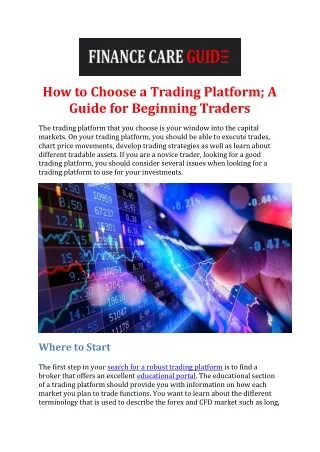
Improve your trading skills with the Fibonacci trading strategy. Understand how to use Fibonacci retracements and extensions for better trade entries and exits.<br><br>

E N D
Need Best Consultation? Need Best Consultation? See How It Works ? Fibonacci Trading Guide | Best Strategies for Forex & Stock Trading See How We work Attain free demo with our consultant Improve your trading skills with the Fibonacci trading strategy. Understand how to use Fibonacci retracements and extensions for better trade entries and exits. Name Name Fibonacci Trading Email Fibonacci numbers are pervasive in the universe and were originally derived by Leonardo Fibonacci. The basic Fibonacci ratio or Email “Fib ratio” is the Golden Ratio (1.61 8). Fibonacci Numbers are a sequence of numbers where each number is the sum of the previous two numbers. Phone Number Phone number The series of Fib Numbers begin as follows: 1,1,2,3,5,8,13 ~ 2 1 ~ 3 4 ~ 5 5 ~ 8 9 ~ 1 417,6104~233..~.. 3 Country There are plenty of materials and books about the theory of Country how these numbers exist in nature and in the ?nancial world. A list of the most important Fib ratios in the ?nancial world which START TRIAL are derived by squaring, square-roots and reciprocating the actual Fibonacci Numbers are depicted below: We work hard to analyze market Key Set of Fibonacci Derived Ratios in Trading are: You may also like to Read 0.382, 0.500, -618, 0.786, 1.0, 1.272, 1.618, 2.0,2.62, 3.62,4.62 Trading Scenario Secondary Set of Fibonacci Derived Ratios in Trading are: Stock of COVID Indices 19 0.236, 0.486,0.886, 1.13,2.236, 3.14,4.236 Trading Stocks And Indices Global and country- speci?c trading Pandemic let’s talk about the current scenario of COVID-19 Most trading software packages have Fibonacci drawing tools which can show Fib retracements, Fib Extensions and Fib Projections. In addition. Fib Numbers are also applied to “time” and to “price” in trading. Tvpes of Fibonacci Read More » Read Retracement: From the swing XA, a Fibonacci ratio length is More » retraced to B. Extension: From the swing XA, more than 100% of the swing 4 Ways to How to XA is extended from A to B. trade in trade forex in the Projection: From the swing XA, a retracement is made to exchange Forex form the AB leg. The swing XA is projected from B to C. for market How To trade in the forex market How beginner Expansion: From the swing XA, a retracement is made at B to Getting Started with Forex Exchange: Step-by-Ste Guide for form AB. A projection is plotted from A in the same direction and length of XA to C. Read More » Read More » Fibonacci Trading When How The chart above illustrates Fibonacci trading from the Russell Emini futures (ER2) 10 minute chart. First, a retracement is shown Does much is in the shaded area for XA to AB. Secondly, an extension of XA to AB is shown. Thirdly, the projection of the XA length is made The the from B to C. In the forgoing projection example, B was retraced to .62 of XA and then a projection of 1.27 to 1.62 of XA swing is Forex minimum expected. C was formed at 1.38 of XA. Market Forex Open trading When Does the Forex Market Open For investing profit per Retracement and Extension Drawing Tools day? Most software packages have Fib retracement and extension Can You Make $100+ Per Day Trading Forex? drawing tools. These tools allow a user to pick a “swing high” and “swing low” and draw retracement and expansion levels. The Fib levels can be also customized for various Fib Numbers. Read More » Read More Another Fib drawing tool is an extension tool. This tool lets a » user pick three different swing points A, B and C and then draw “swing” extensions from C. This is a very valuable tool since it plots ?b. levels from the trade level C. Fibonacci Time Extension Tool Fibonacci extensions can also be measured for “time” levels. Most software packages also provide a Time Extension tool. This tool helps ?nd key turning points using “Fib Time.” It allows a user to pick a “swing low” at A and a “swing high” at B and plot the Fib Time extensions from this time-frame. The projected time levels provide the user with potential “swing” turn points. Apply Now Fibonacci Clusters A con?uence of Fib. retracement numbers signi?es a stronger FOLLOW US ON area of support and resistance. The con?uence of multiple Fibonacci retracements in a fairly tight area are computed using prior swings both retracement and extensions with certain criteria. Then each Fib retracementlextension level is grouped to generate a con?uence within some threshold to ?nd Fibonacci clusters in an area. These “cluster” levels are more signi?cant than a single ?b retracement itself. The trades are either initiated or closed at these con?uence levels. Trading Fibonacci Retracement Levels The chart above illustrates an example of trading Fibonacci ratio levels from the Russell Emini futues (ER2) 610 tick chart. One of the effective method to trade Fibonacci levels is to trade pullbacks in the direction of its primary trend near the Fibonacci retracement levels. For the ?rst “swing” at AB, trade reversal occurred at the 61.8% retracement level. A “long” trade is entered at C with a “stop” order placed below A. On the second “swingvat CD, a “long” trade is entered at the 61.8% retracement level. The swing retraced to E to 78.6%, but rallied back into DE swing. For the second trade, a “stop” order is placed at C. Targets are set at the top of “swing highs” at A, D, F and H. Symmetry Patterns Markets demonstrate repetitive patterns where prices oscillate between one set of price ratios to another making price projections possible. Market trends can be de?ned by geometric relationships as they exhibit harmonic relationships between the price and time swings. Markets also form “cycles” around the price and time levels. Many investorsltraders use “cycles” and “harmonic” relationships to project future swing prices and times. “Symmetry” is visible in all markets and in all time-frames. “Symmetric” rallies and declines give traders an advantage to determine the key turning points. A cluster of similar extensions and similar retracements at key price ranges, or some important levels provide insights into future signi?cant resistance and support levels. In addition to knowing key turning points, the bene?ts of trading symmetric “priceltime” cluster levels include low-risk trades. Gann, Fibonacci and Elliott all have studied market symmetry and found valid theories. These patterns exist in all forms in nature and certainly exist in the markets. One of the best ways to con?rm “Symmetry” in the markets is to check “price” and “time” using two or more cluster con?rmations. Another key method to compute these patterns is to use “percentage change of price” between market “highs” and market “lows.” “Symmetry” is a science by itself and traders take great advantage of knowing the potential turning points/levels using these methods. Trading Symmetry The chart above illustrates the “Symmetry” pattern from the Russell 2000 futures ( E M ) 6 10 tick chart. Symmetrical swing lengths are shown after a 50% retracement at BC swing. Market “symmetry” of 100% extension is expected after a retracement of less than 50% retracement levels. If the retracement exceeds 50%, the extension may be less than or equal to 100%. 1. After ‘BC’ retracement, enter a “long” trade one-tick above the B. 2. Place a “stop” order one-tick below the low of “C”. 3. Target 100% of the AB range from level C to D. 4. Another potential retracement is expected at D to 50% of the entire range of AD. Trading Symmetry Patterns The example above shows “Symmetry” and cluster of harmonic ratios from the Russell 2000 (ER2) 610 tick chart. After BC retracement of 88.6%, a Symmetrical extension at CD is formed near the “cluster” zone. This zone is where two or more harmonic levels are grouped at a single level. The “cluster” is formed at the retracement of 127% to 138% of AB and 127% of BC swings. The zone also acts as key support and resistance areas for trading. After another retracement of DE at 88.6% from the “cluster” zone, ER2 rallied to new intra-day highs. Market Fractals Financial markets are Complex, IVon-Linear and Chaotic. Chaos is the highest form of order and posses a highly deterministic behavior. These chaotic market behaviors are represented by graphical structures usually initiated by a pattern called “Market Fractal.” Trader’s decisions are usually decided by complex series of events and these events in?uence price changes in the markets. Many times, all these events are rhythmically synchronized with Momentum, Volume, Time and Price. Price is the last one in this series to be effected. Traders get signi?cant bene?ts from knowing the beginning of market structures (Fractals). It’s not easy to identify market “Fractals” but there may be a set of rules and patternslevents which may help traders to identify them. “Fractals” are similar patterns which repeat themselves. A beginning “Fractal” pattern resembles the overall pattern of the entire market structures. Fibonacci numbers and Elliott wave patterns were ?rst initiated by “Fractals”. On the expansion, Elliott waves consist of a series of “Fractal” structures. In a simplest market form, as an example, a “Fractal” consists of 5 bars. After a prolonged downtrend in the markets, a 5-bar “Fractal” is formed to signal a potential change in the trend. This “Fractal” has three bars with higher highs and two bars with lower lows. Trades are initiated when another higher-high is formed after this 5-bar “Fractal”. A bearish “Fractal” is the reverse of the above. As in any technical indicator, “Fractals” form, fail, re-fail and re-form. “Fractals” work in all markets and in all time-frames. Fractal theory is very powerful, but it does need con?rmation indicators such as Momentum, Divergence and price-action to be valid. Trading Fractal Patterns The example above shows a “Fractal” pattern formation from the Nasdsq Emini futures (NQ) 610 tick chart. On March 29,2007, NQ futures were in a downtrend all day and lost over 20 points. At about 2:30pm, NQ made a series of higher-highs followed by two lower-low bars to form a “Fractal.” This “Fractal” suggests that a down-trend may be over and a signi?cant trend change may be in the works. 1. After a 5-bar “Fractal” formation, wait for a bar to close above the previous bar’s high and enter a “long” trade above the previous bar’s high. 2. Enter a “stop” loss order below the “Fractal” patterns low. 3. Place a “target” at previous “swing high.” Trading Symmetry Patterns The chart above illustrates an example of sell “Fractal” pattern from the Nasdaq futures (NQ). NQ futures rallied in the morning session and closed near 1808. A series of bars attempted to trade “lower lows” and “higher highs” to form a “Fractal” pattern. A trigger bar is anticipated for a short-sell after a “fractal” formation is complete. 1. Wait for trigger bar, which is a “close” below the low of the previous bar to con?rm the “fractal” setup. 2. Short below the low of the trigger bar. 3. Place a “stop” order one tick above the high of the trigger bar. 4. Target a major “swing low” prior to the “Fractal” formation. Leave a Reply Name (required) Email (required) Website Comment* Save my name, email, and website in this browser for the next time I comment. Post Comment WHO WE ARE? OUR POLICIES Carlos & Company is built on the foundation of trust, transparency, faith, commitment, and dedicated hard work. AML Policy Refund Policy Privacy Policy Risk Disclosure GET SUPPORT FOLLOW US Terms and Conditions Declaration FAQ'S Contact Us
DISCLAIMER – Carlos & Company is not an investment advisor and can neither advise you on your ?nancial goals nor can it access your risk pro?le. We are not providing ?nancial and investment advice. We provide market knowledge and training through webinars and demo signal packages to educate the clients. We provide services for educational and training purposes. We take no responsibility whatsoever for money made or lost as a result of our signals or advice on Forex and Comex-related products we offer. Please consult a quali?ed investment advisor before subscribing to any of the trading packages. Copyright @ CNC LLC. All rights reserved. Automated page speed optimizations for fast site performance