Download
1 / 7
0 likes | 1 Views
Moving averages and Fibonacci Bands are the two most important technical analysis indicators. And when you combine these two elements, the chances of trade success are high. <br><br>Wait, you donu2019t know how to use the Fibonacci moving average? Not to worry. In Carlos and Company this blog, we will have an in-depth study of Fibonacci and moving averages. <br><br>

E N D
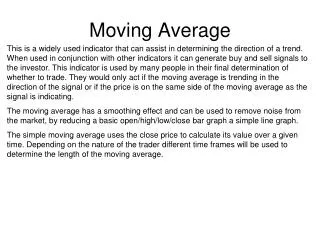
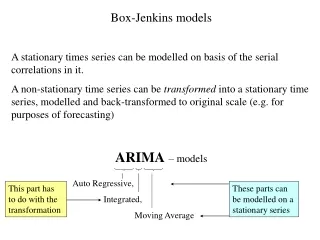
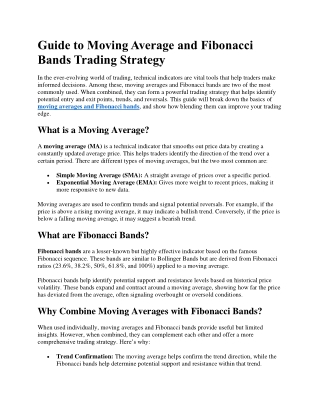
Guide to Moving Average and Fibonacci Bands Trading Strategy In the ever-evolving world of trading, technical indicators are vital tools that help traders make informed decisions. Among these, moving averages and Fibonacci bands are two of the most commonly used. When combined, they can form a powerful trading strategy that helps identify potential entry and exit points, trends, and reversals. This guide will break down the basics of moving averages and Fibonacci bands, and show how blending them can improve your trading edge. What is a Moving Average? A moving average (MA) is a technical indicator that smooths out price data by creating a constantly updated average price. This helps traders identify the direction of the trend over a certain period. There are different types of moving averages, but the two most common are: •Simple Moving Average (SMA): A straight average of prices over a specific period. •Exponential Moving Average (EMA): Gives more weight to recent prices, making it more responsive to new data. Moving averages are used to confirm trends and signal potential reversals. For example, if the price is above a rising moving average, it may indicate a bullish trend. Conversely, if the price is below a falling moving average, it may suggest a bearish trend. What are Fibonacci Bands? Fibonacci bands are a lesser-known but highly effective indicator based on the famous Fibonacci sequence. These bands are similar to Bollinger Bands but are derived from Fibonacci ratios (23.6%, 38.2%, 50%, 61.8%, and 100%) applied to a moving average. Fibonacci bands help identify potential support and resistance levels based on historical price volatility. These bands expand and contract around a moving average, showing how far the price has deviated from the average, often signaling overbought or oversold conditions. Why Combine Moving Averages with Fibonacci Bands? When used individually, moving averages and Fibonacci bands provide useful but limited insights. However, when combined, they can complement each other and offer a more comprehensive trading strategy. Here’s why: •Trend Confirmation: The moving average helps confirm the trend direction, while the Fibonacci bands help determine potential support and resistance within that trend.
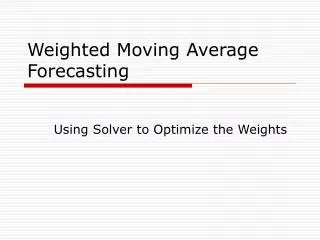
•Improved Entry and Exit Points: Combining the two allows traders to time their entries and exits more accurately, reducing false signals. •Better Risk Management: The bands provide natural areas to place stop-loss and take- profit levels, helping manage risk effectively. How to Use the Moving Average + Fibonacci Bands Strategy Here’s a step-by-step guide to implementing this strategy: Step 1: Choose Your Timeframe First, select the timeframe that suits your trading style. For example: •Day traders may use 5-minute or 15-minute charts. •Swing traders may prefer 4-hour or daily charts. •Position traders might use daily or weekly charts.
The strategy works across all timeframes but should be tested and adjusted according to your preference. Step 2: Add a Moving Average Add a moving average to your chart. Many traders prefer using the 50-period EMA for short- to mid-term trading, or the 200-period EMA for longer-term trends. The EMA is often favored over the SMA for its responsiveness to price changes. Step 3: Add Fibonacci Bands Next, apply Fibonacci bands based on the same period as the moving average. Most charting platforms allow you to customize the bands based on standard Fibonacci levels: 23.6%, 38.2%, 50%, 61.8%, and 100%. These levels will create bands around your moving average line. Step 4: Look for Trading Opportunities Now that you’ve set up your chart, look for trading signals based on price interaction with the moving average and Fibonacci bands. Buy Signal •The price is above the moving average, indicating an uptrend. •Price pulls back toward a lower Fibonacci band (such as 38.2% or 50%) and shows signs of support (e.g., bullish candlestick pattern or bounce). •Enter long on confirmation with a stop loss just below the next lower Fibonacci band or recent swing low. Sell Signal •The price is below the moving average, indicating a downtrend. •Price pulls back toward an upper Fibonacci band (such as 38.2% or 50%) and shows signs of resistance. •Enter short on confirmation with a stop loss just above the next upper Fibonacci band or recent swing high. Step 5: Set Targets and Manage Risk Use the Fibonacci bands to determine your profit targets and stop-loss placements: •Take-Profit: You can target the next Fibonacci band level in the direction of the trend. •Stop-Loss: Set your stop just outside the band where the price showed support or resistance. Always ensure your risk-reward ratio is favorable, ideally 1:2 or better.
Tips for Success •Don’t rely solely on indicators: Combine this strategy with other forms of analysis, such as candlestick patterns, volume, or price action, for stronger confirmation. •Backtest your setup: Before going live, backtest your strategy on historical data to ensure it fits your trading style. •Be patient and disciplined: Not every setup is worth trading. Wait for clear signals that meet your criteria. Final Thoughts The combination of moving averages and Fibonacci bands offers a balanced strategy that can be applied in various markets and timeframes. By identifying trends with moving averages and pinpointing entry zones with Fibonacci bands, traders can enhance their probability of success while maintaining sound risk management. Remember, no strategy guarantees profits, but with consistency, proper planning, and discipline, this approach can become a reliable tool in your trading arsenal. Guide to Moving Average and Fibonacci Bands Trading Strategy In the ever-evolving world of trading, technical indicators are vital tools that help traders make informed decisions. Among these, moving averages and Fibonacci bands are two of the most commonly used. When combined, they can form a powerful trading strategy that helps identify potential entry and exit points, trends, and reversals. This guide will break down the basics of moving averages and Fibonacci bands, and show how blending them can improve your trading edge. What is a Moving Average? A moving average (MA) is a technical indicator that smooths out price data by creating a constantly updated average price. This helps traders identify the direction of the trend over a certain period. There are different types of moving averages, but the two most common are: •Simple Moving Average (SMA): A straight average of prices over a specific period. •Exponential Moving Average (EMA): Gives more weight to recent prices, making it more responsive to new data. Moving averages are used to confirm trends and signal potential reversals. For example, if the price is above a rising moving average, it may indicate a bullish trend. Conversely, if the price is below a falling moving average, it may suggest a bearish trend.
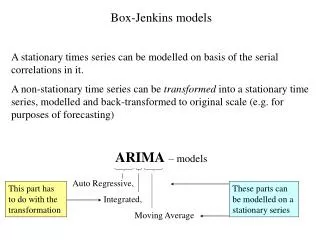
What are Fibonacci Bands? Fibonacci bands are a lesser-known but highly effective indicator based on the famous Fibonacci sequence. These bands are similar to Bollinger Bands but are derived from Fibonacci ratios (23.6%, 38.2%, 50%, 61.8%, and 100%) applied to a moving average. Fibonacci bands help identify potential support and resistance levels based on historical price volatility. These bands expand and contract around a moving average, showing how far the price has deviated from the average, often signaling overbought or oversold conditions. Why Combine Moving Averages with Fibonacci Bands? When used individually, moving averages and Fibonacci bands provide useful but limited insights. However, when combined, they can complement each other and offer a more comprehensive trading strategy. Here’s why: •Trend Confirmation: The moving average helps confirm the trend direction, while the Fibonacci bands help determine potential support and resistance within that trend. •Improved Entry and Exit Points: Combining the two allows traders to time their entries and exits more accurately, reducing false signals. •Better Risk Management: The bands provide natural areas to place stop-loss and take- profit levels, helping manage risk effectively. How to Use the Moving Average + Fibonacci Bands Strategy Here’s a step-by-step guide to implementing this strategy: Step 1: Choose Your Timeframe First, select the timeframe that suits your trading style. For example: •Day traders may use 5-minute or 15-minute charts. •Swing traders may prefer 4-hour or daily charts. •Position traders might use daily or weekly charts. The strategy works across all timeframes but should be tested and adjusted according to your preference. Step 2: Add a Moving Average Add a moving average to your chart. Many traders prefer using the 50-period EMA for short- to mid-term trading, or the 200-period EMA for longer-term trends. The EMA is often favored over the SMA for its responsiveness to price changes.
Step 3: Add Fibonacci Bands Next, apply Fibonacci bands based on the same period as the moving average. Most charting platforms allow you to customize the bands based on standard Fibonacci levels: 23.6%, 38.2%, 50%, 61.8%, and 100%. These levels will create bands around your moving average line. Step 4: Look for Trading Opportunities Now that you’ve set up your chart, look for trading signals based on price interaction with the moving average and Fibonacci bands. Buy Signal •The price is above the moving average, indicating an uptrend. •Price pulls back toward a lower Fibonacci band (such as 38.2% or 50%) and shows signs of support (e.g., bullish candlestick pattern or bounce). •Enter long on confirmation with a stop loss just below the next lower Fibonacci band or recent swing low. Sell Signal •The price is below the moving average, indicating a downtrend. •Price pulls back toward an upper Fibonacci band (such as 38.2% or 50%) and shows signs of resistance. •Enter short on confirmation with a stop loss just above the next upper Fibonacci band or recent swing high. Step 5: Set Targets and Manage Risk Use the Fibonacci bands to determine your profit targets and stop-loss placements: •Take-Profit: You can target the next Fibonacci band level in the direction of the trend. •Stop-Loss: Set your stop just outside the band where the price showed support or resistance. Always ensure your risk-reward ratio is favorable, ideally 1:2 or better. Tips for Success •Don’t rely solely on indicators: Combine this strategy with other forms of analysis, such as candlestick patterns, volume, or price action, for stronger confirmation. •Backtest your setup: Before going live, backtest your strategy on historical data to ensure it fits your trading style. •Be patient and disciplined: Not every setup is worth trading. Wait for clear signals that meet your criteria.
Final Thoughts The combination of moving averages and Fibonacci bands offers a balanced strategy that can be applied in various markets and timeframes. By identifying trends with moving averages and pinpointing entry zones with Fibonacci bands, traders can enhance their probability of success while maintaining sound risk management. Remember, no strategy guarantees profits, but with consistency, proper planning, and discipline, this approach can become a reliable tool in your trading arsenal.