Download
1 / 37
370 likes | 507 Views
Urban Air Quality and its Management in China, P.R. LI Xinmin State Environmental Protection Administration 27 September 2006. Environmental pollution not radically controlled. The total SO 2 emission was 25.49 million tons in 2005, up 27% compared to 2000;

E N D
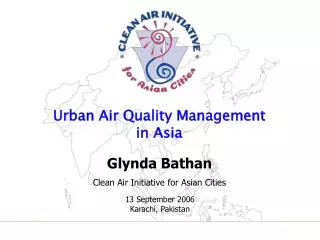
Urban Air Quality and its Management in China, P.R. LI Xinmin State Environmental Protection Administration 27 September 2006
Environmental pollution not radically controlled • The total SO2 emission was 25.49 million tons in 2005, up 27% compared to 2000; • 40% of the 522 cities were lower than the Grade II of NAAQS; There was not even one city compliant to Grade II of NAAQS in Shanxi Province. • Acid rain occurred in more than half of the 696 cities and counties
Energy • Coal is the primary energy source in PRC and its consumption is expected to continue to increase from 1.3 billion tons in 2000 to between 2.1 and 2.9 billion tons in 2020 dominating more than 50% of primary energy share until 2020 • Petroleum/Crude Oil will account for about 27% of total primary energy in 2020”
Energy Consumption and Air Pollutant Emission SO2 emission dust emission coal consumption
Registered Motor Vehicles in China, P.R. • Ownership of automobiles and motorcycles has exceeded 43 million and 94 million respectively by the end of 2005 registering an increase of 20.6% for cars and 23.6% for motorcycles compared in 2004
Motor Vehicle Growth Forecast 3.5 x by 2025 9 x by 2025 Vehicle Population Projection from Segment Y plc See: http://segmenty.com
Rapid Increase in Electric Bicycles • Electric bikes are gaining an increasing share of two-wheeled transportation in P.R. China • Defined as “special two-wheel bike motivated by both manpower and electrical power, using storage battery as supplementary power” • Annual electric bike sales in P.R. China grew from 40,000 in 1998 to 10 million in 2005 • Dramatic growth has been largely due to legislations banning gasoline-fuelled scooters and bicycles, introduced from 1996 onwards in several major Chinese cities, including Beijing and Shanghai
Emissions Inventories • SEPA regularly conducts regular emissions inventories • SO2 increased steadily from the 1990s to the 1995 but slowly dipped again from 1995 to 1999, after which they started to increase again • For 2004, the total SO2 emissions reported by State Environmental Protection Administration (SEPA) were about 22.5Mt. • Nitrogen oxide emissions have increased consistently and in 2003 were almost twice the 1990 emissions. • Smoke dust and industrial dust on the other hand have shown decreasing trends since 1997
National Acid Deposition and SO2 Pollution Status The area of acid rain was stable in 2005, but the frequency was increased. The acid intensity was increased in acid rain zone. Generally, acid rain pollution was aggravated.P.R. China SO2 emissions are concentrated mostly in the Central and East coastal areas - area with heavy industries. 58.3% of the cities in Central China experienced acid rain with 21.4% experiencing occurrence of over 80%”
Acid Deposition Zones • Six serious acid deposition zones • Southwest • Pearl River Delta • Yangtze River Delta • Huai Sea zone • Big Beijing zone • Three West zone (Shanxi, Shaanxi and Inner Mongolia). • The acid deposition is much higher than the environmental capacity in these areas.
Air quality challenges from the power sector in the 11th Five-Year Plan period • In 2005, the national power generation capacity was 512 million kw, of which thermal power was 389 million kw. It is expected that the new built thermal power generation capacity will be 72 million kw in 2006. • The new built power generation capacity will reach 300 million kw by 2010 and the total power generation capacity will reach 818 million kw with an annual growth rate of 9.8%. • The coal consumption in 2005 was 2.1 billion tons, of which 0.93 billion tons were consumed for power generation. The SO2 emission in 2005 was 25.495 million tons, of which 13 million tons were emitted by power sector. • Coal consumption in 2006 will be around 2.2 billion tons and produced SO2 amount will be around 29.5 million tons. • Coal consumption in 2010 will be around 2.5 billion tons, of which 1.68 billion tons will be consumed for power generation, and produced SO2 amount will be around 43.49 million tons, of which 23.6 million tons will be produced by power sector.
Main Causes Environmental Problems caused by coal fired power plants (1) • Low efficiency and high emission The national average unit coal consumption of power generation is 374g/kw.h in 2005, much higher than the international advanced level of 50~60g/kw.h • Coal is rich in north and west and lack in south and east. The east area consumes 55% the national total electricity but only holds 10% of the national total coal resource. • The environmental capacity and electricity demand don’t match. The power generation capacity of east area contributes to 54% of the national total while the environmental capacity is limited; the west area is affluent in resources and environmental capacity while the power generation capacity is less.
Main Causes Environmental Problems caused by coal fired power plants (2) • Unreasonable structure of electricity sources: hydropower generation capacity is more than 0.1 billion kw while the proportion to total power is only 25%. Nuclear power generation capacity is 6.85 million kw, accounting for 1.34% of the national total, much lower than the international average level of 10%. Electricity generated from new energy such as sun energy only contributes 0.24% of the national total, much lower than the international average level of 1%. • Small thermal power units operational again: These units have energy efficiency as low as 700g/kw.h and are uneconomical for installation of desulfurization facilities. • The quality of coal is getting worse: lower heat value, higher ash and sulfur content
2000年 2010年 2020年 NOx Emission Trend in China (2000-2020)
Forecast of NOx Increase Trend Comparison of NOx Emission Inventories for 2010 and 2020 by sector
Main Causes for AQ Problems • Rapid development of heavy chemical industry, prominent structural pollution, unreasonable industrial structure • High energy consumption, increase of 2 billion tons of coal and 0.4 billion tons of petroleum consumed in 2000-2005 compared to 1995-2000 • Rapid motorization • Extensive economic development pattern, high growth paid by high cost • Weak awareness on environmental regulation, unsound legal system, slack enforcement, low cost of violation, and high cost of compliance. • Environmental protection issue separated from decision making
Air Quality Monitoring • There are 2,289 monitoring stations in the country that employ more than 45,849 personnel to conduct monitoring work • The government’s five-year plan for ambient air quality monitoring for all cities directly under a province required the establishment of an urban automatic ambient air monitoring system as well as an urban acid rain monitoring system for all cities by 2005 • As of June 2004, there were 688 automatic air quality monitoring units in place in 234 cities • In 2004, there were 527 cities able to monitor acid rain occurrences • For dust and sandstorms monitoring, the National Meteorological Bureau of China has set up six special sandstorm monitoring stations equipped with automatic devices at the source and along major routes of sandstorms in North China’s Inner Mongolia as part of the ‘Sandstorm Project’ of the SEPA
PRC National Ambient Air Quality Standards* compared with WHO and US * Chinese cities are required to comply with Class II NAAQS
Status of Air Quality: API trends • The share of the population living in cities meeting the NAAQS accounted for 33.1% of the total in 2004, decreasing by 3.3% compared with 2003 • Decrease in percentage of cities with air quality worse than class 3 of NAAQS from 40.5% in 1999 to 20.3% in 2004 and the increase of cities complying with Class 2 (from 33.1% in 1999 to 38.6% in 2004) and Class 3 (from 26.3% in 1999 to 41.2% in 2004) of the NAAQS
Status of Air Quality (2) PM10 levels in Major Chinese Cities (1999 – 2005) NAAQS Class II PM10 limit = 100µg/m3
Status of Air Quality (3) SO2 levels in Major Chinese Cities (1999 – 2005) NAAQS Class II SO2 limit = 60µg/m3
Status of Air Quality (4) NO2 levels in Major Chinese Cities (1999 – 2005) NAAQS Class II NO2 limit = 80µg/m3
Air Quality Management Policies (1) • The Environmental Protection Law (EPL) of PRC adopted in 1989 is the country’s primary law that provides the legal framework for the prevention and control of pollution • In 1987 the Prevention and Control of Atmospheric Pollution Law (LPCAP) was created and later updated in 1995 and in 2000 • SEPA under the State Council conducts unified supervision and management of environmental protection throughout the country • SEPA’s local counterparts are the Environmental Protection Bureaus (EPBs) or offices (EPOs) and they administer, supervise, and manage environmental protection activities at the provincial, municipal, county, and district level
Air Quality Management Policies (2) • Within SEPA the primary responsibility for urban air quality managements rests with the Pollution Control Department • PCD can call upon the assistance of the National Environmental Monitoring Centre, the Chinese Research Academy for Environmental Sciences, and other specialized institutions • Air quality management capabilities of Chinese cities vary strongly • The capacity of cities in the coastal belt is better developed than those in the Western cities • Several cities either have received or are still receiving assistance from bilateral development agencies to strengthen their air quality management systems
Air Quality Management Policies Mobile Sources (1) • P.R. China is at the forefront in institutionalizing vehicle emissions standards in developing countries in Asia • In addition to Beijing, Guangzhou has adopted the Phase III (Euro III equivalent standards) and Shanghai has already requested for approval from the State Council Vehicle Emissions Standards for Light-duty Vehicles in China Source: GB 18352.1-3
Air Quality Management Policies Mobile Sources (2) • Fuel Consumption Limits for Light Duty Passenger Vehicles were published on September 2, 2004 and implemented in July 2005 – P.R. China became the first Asian country to implement such standards • The first phase of the standard targeting a reduction of 5% in per-distance fuel consumption was implemented in 2005, and a second phase, with a goal of 10% reduction in fuel consumption for each weight category in 2008 • It is forecasted that 13 million tons of fuel will be saved in 2020 and 31 million tons in 2030
Air Quality Management Policies Mobile Sources (3) • The 11th Five-Year Plan of P.R. China will prioritize the development of public transportation with mass rapid transit (MRT) as a key transport mode in mega cities and the NRDC has issued guidelines for implementation with the following provisions: • Develop BRT system • Public transportation enterprises should increase the bus density, choose safe, energy-efficient and environment-friendly buses and scrap the high-polluting and low-technology buses • The governmental fund to be used in urban transportation construction shall favor public transportation and cities should implement economic subsidy and compensation policy for the public transportation • The price of public transportation should pay attention to both economic benefits and social benefits, and the business cost of the enterprises and the paying capacity of the public
Air Quality Management Policies Stationary Sources (1) • P.R. China's emission standards for stationary sources relating to air pollutants can be divided into two categories: (1) those for particular industries or particular types of pollution and (2) general standards specified in the Integrated Emission Standard of Air Pollutants (IESAP). • Stationary sources are classified as boilers, thermal power plants, industrial kilns and furnaces, coke ovens and cement plants and are required to comply with the corresponding emissions standards • The IESAP was enacted in 1996 and came into effect in 1997, it prescribes two sets of emission limits, one for new facilities installed on or after January 1, 1997, and another set for existing facilities installed prior to that date
Air Quality Management Policies Stationary Sources - SO2 Control (2) • In the 11th Five-year plan, SO2 emission reduction is the emphasis of air pollution prevention and control and states that the emissions of sulfur dioxide should be reduced by 10% by 2010 • The three principal components of existing SO2 emissions control policy are the Pollution Levy System (PLS), Two Control Areas (TCA), and Total Emissions Control (TEC) • PLS is based on the polluter pays principle • TCA is not an instrument like the pollution levy for affecting abatement behavior, but rather a means for prioritizing SO2 control efforts, designating the standards, and identifying cities and regions that should receive extra attention and resources from the national government • TEC limits the polluters to discharge under a specified level and levies the charge when any pollution is discharged • Planning for the future: • Keep implementing the Total Emission Control systems • Estimation of environmental capacity • Set reduction goals for east, middle part and west • Separate the emission reduction goal of power sector from the overall goal • The high pollution sources controlled by the state • Measuring the performance by emission per unit power generation • Strengthening the construction of automatic on-line monitoring network
Air Quality Management Policies Area Sources – Dust and Sandstorms • The Chinese government ratified the UN Convention to Combat Desertification (CCD) in December 1996 • As a follow-up, the China National Committee to Implement the UN CCD (CCICCD) was set up and a China National Action Program (NAP) to Combat Desertification was prepared • Government also earmarked CNY54 billion (about $6.5 billion) for a 10-year program to address the DSS concern in the northern PRC
Conclusions and challenges ahead (1) • Trends of APIs from 1999 to 2004 suggest that air quality in Chinese cities is generally improving and confirmed by the percentage increase of cities complying with Class 2 (from 33.1% in 1999 to 38.6% in 2004). • However, the actual ambient air quality levels for PM10, SO2, and NO2, though generally improving are still above the WHO guidelines • For the future the days of above grade II of NAQQS in 65% of the key cities > 292; • To meet the air quality goals for the coming years, improvements will need to be made in • the monitoring of air quality • the capacity to develop and implement air quality management plans • the coordination at the national and local level among relevant bureaus and agencies at different levels of government in implementing and developing AQM
Conclusions and challenges ahead (2) • The SO2 control policy in the 11th Five-Year Plan of the government is very timely because in this same period coal use in P.R. China is expected to increase as demand for energy also increases • The national emission of SO2 reduced by 10% • Total SO2 emission < 22.94 million tons • SO2 emitted by power sector < 10 million tons • Regarding SO2, the energy consumption in 2010 will reach 3 billion tons of standard coal and the raw coal consumption will be around 2.8 billion tons, emitting SO2 by 43 million tons. To achieve the SO2 emission goal of 22.94 million tons, the SO2 reduction shouldn’t be lower than 20 million tons while the current treatment of SO2 is only 9.5 million tons. This means that capacity to reduce another 10.5 million tons needs to be created. • The intensity and frequency of acid rain should be mitigated
Conclusions and challenges ahead (3) • Promoting environmental protection by resource conservation. The energy consumption per unit GDP should be reduced by 20%. If the resource conservation goal can’t be realized, it is almost impossible to fulfill the emission reduction goal. • Investing more in pollution control. The total investment for environmental pollution control during the 11th Five-year Plan period is 1.3 trillion yuan. The annual investment demand is 260 billion yuan, accounting for a little higher than 1%.
Conclusions and challenges ahead (4) • Strictly implementing relevant laws and regulations • Build larger capacity for AQM at the national, provincial and local levels • Integrating environmental protection index into the governmental performance evaluation system and ensure clear responsibilities at various governmental levels • Promoting purchase of SO2 emission permit and emission trading pilot projects • Fully implementing emission permit system and promoting market based approaches to pollution control.
Conclusions and challenges ahead (5) • Great efforts should be made for control of particulate matter, especially fine particles. • The removal of industrial pollution sources in urban areas through scrapping of low and small pollution sources should be sped up. • The energy efficiency and the rate of clean energy should be increased by developing combined heating supply and power generation, centralized heating, setting high-polluting fuels forbidden zones, etc. • The pre-warning system of photochemical smog pollution needs to be established. • Add new power generation capacity with desulfurization facilities by 100 million kw and 146 million kw by the end of the period, installing desulfurization facilities for all of the newly built power generation units, not allowing building of new coal-fired power plants in large or mid-sized cities and their near suburbs or the areas where the acid rain pollution is serious or the SO2 concentration is higher than the standard. • Strengthening the air pollution prevention and control for industries.
Conclusions and challenges ahead (6) • Vehicle emission control needs to be enhanced to deal with the rapid increase of numbers of vehicles • Fuel road map needs to be developed leading up to Euro 4 for all regions of the country • In-use vehicle emission strategy needs to be developed which addresses gross polluting vehicles including strengthening of I/M systems • Policy on motorcycles to be developed to ensure that emissions from these type of vehicles are reduced
Thank You Thank You !