Download

1 / 13
140 likes | 361 Views
Material Taken From: Mathematics for the international student Mathematical Studies SL Mal Coad , Glen Whiffen , John Owen, Robert Haese , Sandra Haese and Mark Bruce Haese and Haese Publications, 2004. Section 5H – Box -and-Whisker Plots. Box Plots.

E N D
Material Taken From:Mathematicsfor the international student Mathematical Studies SLMal Coad, Glen Whiffen, John Owen, Robert Haese, Sandra Haese and Mark BruceHaese and Haese Publications, 2004
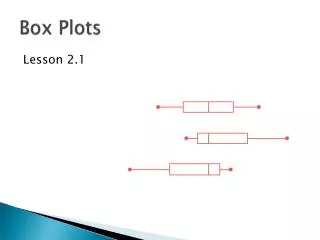
Section 5H – Box-and-Whisker Plots Box Plots Box-and-whisker plots are useful ways to summarize data and illustrate its variability. It consists of a rectangular box with hinges at Q1 and Q3. Segments extending from the ends of the box are called whiskers which stop at the extreme values of the set.
Box Plots The inter-quartile range is the width of the box. The maximum length of each whisker is 1.5 times the inter-quartile range. Any data value that is larger than (or smaller than) 1.5 × IQR is marked as an outlier.
To Create a Box-and-Whisker Plot: • Make a number line. • Create the box between Q1 and Q3. • Draw in Q2. • Determine any outliers: • Upper boundary = Q3 + 1.5(IQR) • Lower boundary = Q1 – 1.5(IQR) • Plot any outliers. • Extend the whiskers to the maximum & minimum (provided they’re not outliers).
Problem 1 Make a box-and-whisker plot from this data. Test Scores,3rdPeriod Class 42 58 61 64 68 69 72 74 74 75 78 78 79 82 82 82 86 88 91 94 98 99
Section 5K – Parallel Box and Whisker Plots 2) A hospital is trialing a new anesthetic drug and has collected data on how long the new and old drugs take before the patient becomes unconscious. They wish to know which drug acts faster and which is more reliable. Old drug times: 8, 12, 9, 8, 16, 10, 14, 7, 5, 21, 13, 10, 8, 10 11, 8, 11, 9, 11, 14 New drug times: 8, 12, 7, 8, 12, 11, 9, 8, 10, 8, 10, 9, 12, 8, 8, 7, 10, 7, 9, 9 Prepare a parallel box plot for the data sets and use it to compare the two drugs for speed and reliability.
To do a Box-and-Whisker on theCalculator: Type data into L1 Go to StatPlotand turn a plot on Choose the box-and-whisker with outliers Choose your list Zoom 9 : Stat
The Military Draft Lottery (Source: Selective Service System - June 25, 2001 revision) http://www.landscaper.net/draft.htm For more than 50 years, Selective Service and the registration requirement for America's young men have served as a backup system to provide manpower to the U.S. Armed Forces. President Franklin Roosevelt signed the Selective Training and Service Act of 1940 which created the country's first peacetime draft and formally established the Selective Service System as an independent Federal agency. From 1948 until 1973, during both peacetime and periods of conflict, men were drafted to fill vacancies in the armed forces which could not be filled through voluntary means.
The Military Draft Lottery (Source: Selective Service System - June 25, 2001 revision) http://www.landscaper.net/draft.htm In 1973, the draft ended and the U.S. converted to an All-Volunteer military. The registration requirement was suspended in April 1975. It was resumed again in 1980 by President Carter in response to the Soviet invasion of Afghanistan. Registration continues today as a hedge against underestimating the number of servicemen needed in a future crisis.
The Military Draft Lottery (Source: Selective Service System - June 25, 2001 revision) http://www.landscaper.net/draft.htm December 1, 1969 marked the date of the first draft lottery held since 1942. This drawing determined the order of induction for men born between January 1, 1944 and December 31, 1950. A large glass container held 366 blue plastic balls containing every possible birth date and affecting men between 18 and 26 years old.
The Military Draft Lottery The first date drawn from the glass container received draft number one and eligible men born on that date were drafted first. In a truly random lottery there should be no relationship between the date and the draft number.
1970 Military Draft Lottery This dataset suggests that men born later in the year were more likely to be drafted.
Homework • 5H, page 148 • #1, 2, 3 • 5K, page 159 • #1, 3