Download
1 / 29
290 likes | 512 Views
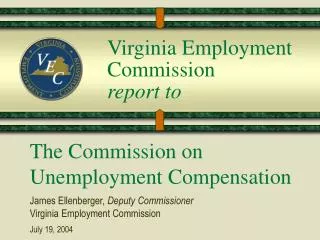
Virginia Employment Commission report to. The Commission on Unemployment Compensation Dolores Esser, Commissioner Virginia Employment Commission December 16, 2008. Virginia’s Unemployment Rates 2006 - 2008 (year to date). This year all unemployment rates have been above the year-ago rates.

E N D
Virginia Employment Commission report to The Commission on Unemployment Compensation Dolores Esser, CommissionerVirginia Employment Commission December 16, 2008
Virginia’s Unemployment Rates2006 - 2008(year to date) • This year all unemployment rates have been above the year-ago rates. • August’s rate of 4.6 percent was the highest rate since January 1997’s 4.7 percent. Percent of Labor Force Note: Not Seasonally Adjusted
Current Economic Situation The Nation, Virginia, and Virginia Areas
The Nation • The National Bureau of Economic Research (NBER), the Princeton, New Jersey, think tank that officially designates U.S. recessions, has recently announced that the U.S. has been in a recession since December 2007. The NBER sometimes does not define recessions until a couple of years later. (They did not fully define the March-November 2001 recession officially until July 2003.)
The Nation - continued • As a result of the financial and housing crises, the already looming recession has been worsened and prolonged. • As a result of what has already happened: • It now looks like recession in the U.S. will last through 2009 with a slow recovery in 2010. • Employment and unemployment are the “caboose” of the economic train—always the last to turn around in both good and bad times.
The Nation - continued • It looks like the current downturn will be slightly worse than the 1991 recession, but not as bad as the 1982 recession. • Employment should drop an additional 1.5 percent. • Unemployment should peak about 8.5 percent at the beginning of 2010.
Virginia • Virginia, as usual, is expected to perform better than the nation because over half of Virginia employment is in the less recession-prone: • Professional and business services • Health care • Public and private higher education • Federal government and defense
Virginia - continued • Virginia should see negative job growth throughout 2009. • Virginia unemployment should peak at just over 6.0%. • A worst case scenario would have U.S. unemployment over 9% and Virginia unemployment approaching 7%.
UI Initial Claims2006 - 2008(year to date) • Total initial claims through October this year are up 21.5% because of more motor vehicle, furniture, textiles, building-related, and finance layoffs. For the same period, initial claims are up 22.0% from 2006.
Workload* *2006 and 2007 actual; 2008, 2009, and 2010 projected
UI First Payments2006 - 2008(year to date) • A claimant can receive only one first payment in his benefit year; so first payments are a good proxy for the number of claimants receiving unemployment benefits. • Through October, first payments are up 27.5% from last year, and up 32.2% from 2006. • The average duration in October was 12.6 weeks, unchanged from last October’s level.
UI Final Payments2006 - 2008(year to date) • For the first ten months of 2008, final payments are up 21.7% from 2007 and up 25.1% from 2006. • The exhaustion rate in October was 37.1%, up from last October’s 33.1%.
Trust Fund Data—Standard Forecast (Millions of Dollars) (Projections will be updated in December) *$16.6 million in Reed Act money deducted from Trust Fund balance for FY’s 2009 and 2010 appropriations for JS and UI administration. Actual Projected
Standard Forecast— 1990 - 1991 Scenario • Loans 2010q1--$25.7 million paid back by 6/30/2010 2010q2--$56.2 million paid back by 6/30/2010 2011q1--$103.3 million paid back by 6/30/2011 2011q2--$46.8 million paid back by 6/30/2011 • Total--$232.0 million
June 30 Balances (millions) and Solvency Level 1997 - 2014 • When solvency drops below 50%, Fund Builder Tax is triggered the following year. (Projections will be updated in December) • 2009– 2014 projected.
Average Tax per Employee1997 - 2014 • The increases from 2003 through 2014 are the result of higher benefit schedules and the recessions. (Projections will be updated in December) • Fund Builder Tax in effect. • 2008 – 2014 projected.
Average Tax per EmployeeFourth Circuit – Year ending 3/31/08 Cost per Employee
1981-1982 Recession Scenario • Loans would total about $800 million. • The trust fund would have negative balances for 11 straight quarters—2009q4 through 2012q2. In some of these quarters, the loan balance is reduced, but not to zero. • The cash balances for June 30, 2010 and 2011 are negative.
1981-1982 Recession Scenario • The 2010 solvency level is negative. • Total interest payments from 2010 to 2012 would be about $25 million. Interest payments in 2010 and 2011 would each be over $10 million or about 3 times the current annual Penalty and Interest revenue, the source for such payments. Interest payments in 2012 would be about $4 million. • In 2011 employers would lose 0.3 percentage point of the FUTA credit and pay an additional $90 million in FUTA taxes or an additional $21 per employee.
Emergency Unemployment Compensation (Federally Funded) • Exhausted all rights to regular compensation – May 1, 2007 • Total amount equal to 50% of their regular benefits • TRA claim is suspended until EUC is exhausted and TRA may be resumed • On November 21, 2008, Congress authorized up to an additional 7 weeks of benefits.
Emergency Unemployment Compensation (Federally Funded) • Through November 28, 2008: • Applications mailed 78,720 • Claims processed 31,381 • Total amount paid $54.7 million
Virginia Employment Commission report to The Commission on Unemployment Compensation Dolores Esser, CommissionerVirginia Employment Commission December 16, 2008