Download
1 / 6
60 likes | 64 Views
Learn how you can get involved in this research project aimed at addressing the challenges faced by LGBTQI+ individuals. Discover actionable steps and opportunities for community input at every stage.

E N D
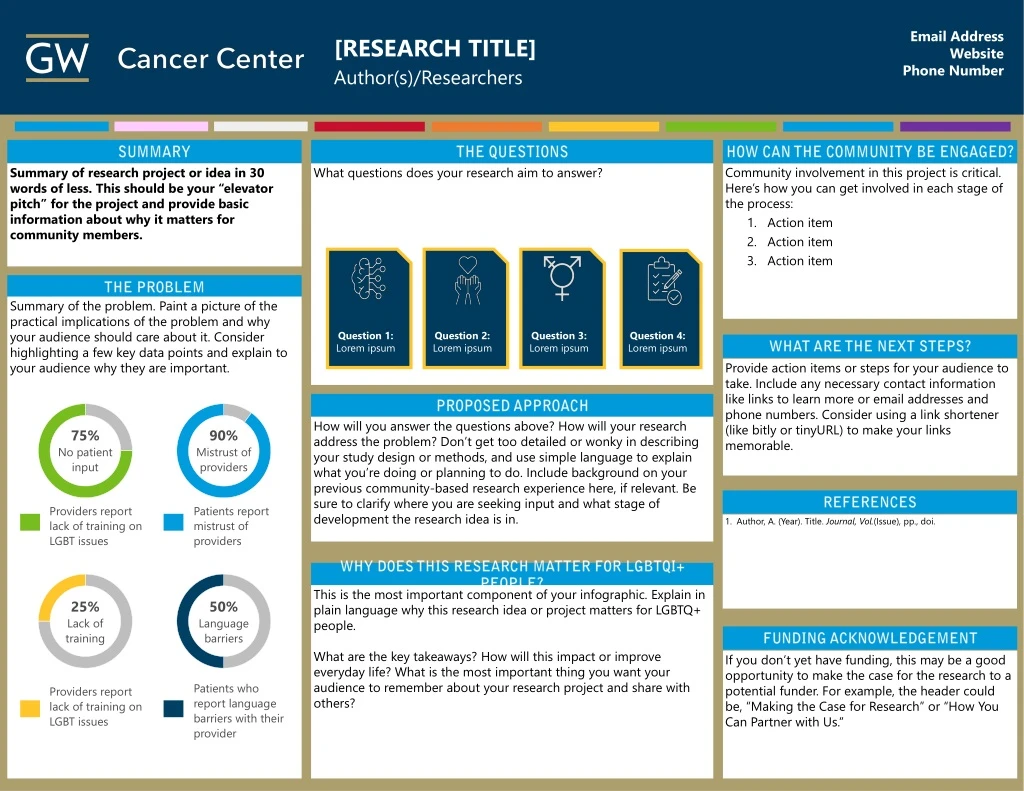
[RESEARCH TITLE] Author(s)/Researchers Email Address Website Phone Number SUMMARY THE QUESTIONS HOW CAN THE COMMUNITY BE ENGAGED? Summary of research project or idea in 30 words of less. This should be your “elevator pitch” for the project and provide basic information about why it matters for community members. What questions does your research aim to answer? Community involvement in this project is critical. Here’s how you can get involved in each stage of the process: Action item Action item Action item Question 1: Lorem ipsum Question 2: Lorem ipsum Question 3: Lorem ipsum Question 4: Lorem ipsum THE PROBLEM Summary of the problem. Paint a picture of the practical implications of the problem and why your audience should care about it. Consider highlighting a few key data points and explain to your audience why they are important. WHAT ARE THE NEXT STEPS? Provide action items or steps for your audience to take. Include any necessary contact information like links to learn more or email addresses and phone numbers. Consider using a link shortener (like bitly or tinyURL) to make your links memorable. PROPOSED APPROACH How will you answer the questions above? How will your research address the problem? Don’t get too detailed or wonky in describing your study design or methods, and use simple language to explain what you’re doing or planning to do. Include background on your previous community-based research experience here, if relevant. Be sure to clarify where you are seeking input and what stage of development the research idea is in. 75% No patient input 90% Mistrust of providers REFERENCES Providers report lack of training on LGBT issues Patients report mistrust of providers Author, A. (Year). Title. Journal, Vol.(Issue), pp., doi. WHY DOES THIS RESEARCH MATTER FOR LGBTQI+ PEOPLE? This is the most important component of your infographic. Explain in plain language why this research idea or project matters for LGBTQ+ people. What are the key takeaways? How will this impact or improve everyday life? What is the most important thing you want your audience to remember about your research project and share with others? 25% Lack of training 50% Language barriers FUNDING ACKNOWLEDGEMENT If you don’t yet have funding, this may be a good opportunity to make the case for the research to a potential funder. For example, the header could be, “Making the Case for Research” or “How You Can Partner with Us.” Patients who report language barriers with their provider Providers report lack of training on LGBT issues
HOW TO USE THIS POSTER TEMPLATE All portions of this poster template should be editable. The colors are preset to the following GW color codes, but can be updated as needed. If you would like to include additional icons or materials in GW colors, the RGB codes are listed in the image below. To create a custom fill color, including the ones below, click on the object you would like to change. For fill or outline select “more colors” option, then click the “custom” tab on the right and fill in the RGB colors as indicated. To edit the optional graphs in the “Problem” section, click on the graph. Then select the “Graph Tools” and click “Design” and “Edit Data.” They are preset to percentages, but it can be changed as needed. If you are still in the exploratory stage or don’t have specific data points to highlight, consider replacing the graphs with icons from the graphics library. All of the icons in the graphics library can be copied and pasted into the document in various places. To change the color of an icon, click the icon. Under “picture tools,” select “Format” and select “Color” to choose different color options for the icon(s). Other Infographic and Design Tools: • Canva.com • Piktochart • Easelly • Infogram • The Gender Spectrum Collection: Stock Photos Beyond the Binary