Download
1 / 26
280 likes | 565 Views
USAID BUDGET PROCESS. February 2002. Objective. By the end of this presentation, you should explain the complexity of the USAID budget process, the directives and funding trends of the population, health and nutrition budget and their impact on Regional allocations. Role of Congress.

E N D
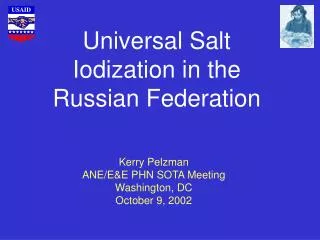
USAID BUDGET PROCESS February 2002
Objective By the end of this presentation, you should explain the complexity of the USAID budget process, the directives and funding trends of the population, health and nutrition budget and their impact on Regional allocations.
Role of Congress • Legislates annual appropriations • Sets significant earmarks and directives • May apply restrictions to funding Congressionalearmarks and directives may not always correspond to White House priorities
Federal Budget Managed by OMB • The federal budget consists of 18 functional funding “accounts” • USAID programs are part of the “150” or “International Affairs” account • Other 150 programs include State, Peace Corps, multilaterals, military assistance
Allocation of U.S. Budget < 1% USAID managed 37.5% of IA budget US Budget for FY 1999. Source OMB
Accounts Managed by USAID • Development Assistance (DA) (included family planning and reproductive health through 2001) • Child Survival and Diseases (CSD) • Child Survival Health (CSH) in 2002 (includes family planning and reproductive health) • Economic Support Funds (ESF) • Others, such as • International Disaster Assistance • P.L. 480 Title III sales proceeds • FSA (Freedom Support Act, ex.-Soviet Union) • AEEB (Support Eastern Europe Democracy) • Operating Expenses • Development Credit Authority
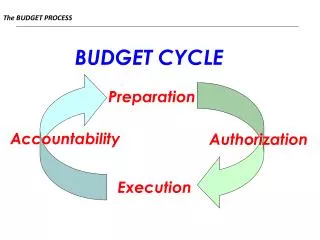
USAID Budget Process Congress USAID Mission/Bureau Requests (within parameters) Congressional Appropriation Hearing/ House/ Senate Mark-up July July Sept. April Sept. April Obligations OMB Submission Jan. Jan. Operational Year Budget Set Administration's Stat Annex/ Request Notifications
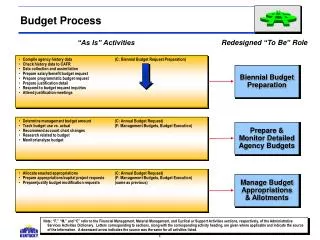
ILLUSTRATIVE PROGRAM BUDGET CYCLE 1 • Below is a month-by-month breakout of the events in the program and budget cycles*. Events described cover three budget years and four budget stages: FY 2001 (October 2000 - September 2001) the current operating year (OYB), FY 2002 (October 2001 - September 2002) the proposed budget year and FY 2003 (October 2002 - September 2003) the request year. Thus, during 2001, Formulation involves the request year (FY 2003); Justification deals with the proposed year (FY 2002); and Implementation covers completion of the current operating year (FY 2001) and the beginning of the subsequent operating year (FY 2002). • CY 2001 FormulationJustificationImplementation • (FY 2003) (FY 2002) (FY 2001/FY 2002) • January Strategic Plans FY 2002 Pres. Budget Implement FY 2001 OYB • February Strategic Plans FY 2002 CBJ to Congress Implement FY 2001 OYB • March Agency Guidance • on FY 2003 • Results Review FY 2002 Hearings Implement FY 2001 and Resource • Request (R-4) • April Bureau FY 2003 FY 2002 Hearings Implement FY 2001 OYB • guidance (R4) • May Operating Units Congressional Budget • Prepare FY 2003 R-4s Resolution FY 2002 Implement FY 2001 OYB • July FY 2003 BPBS Cong. Mark-up Implement FY 2001 OYB • Submitted floor action • August FY 2003 Budget Congressional • Reviews Recess until Labor Day Implement FY 2001 OYB • September FY 2003 OMB Complete FY 2002 Wrap-up FY 2001 OYB • Submission appropriations • October OMB Reviews New Appropriation Set FY 2002 OYB of 2003 request Bill on Continuing 653 (a) report • Resolution • November FY 2003 OMB Implement FY 2002 OYB • Passback • December FY 2003 appeal and Implement FY 2002 OYB • President’s Mark. • Begin FY 2003 CBJ • Mark. Begin FY 2003 CBJ • * Note: These time frames reflect the ideal, but may be adjusted to reflect reality.
ILLUSTRATIVE PROGRAM BUDGET CYCLE 2 • June Operating Units Cong. Mark- up Implement FY 2001 OYB, • Submit R4s to of FY 2002 Request Green Book • Bureau • July FY 2003 BPBS Cong. Mark-up Implement FY 2001 OYB • Submitted floor action • August FY 2003 Budget Congressional • Reviews Recess until Labor Day Implement FY 2001 OYB • September FY 2003 OMB Complete FY 2002 Wrap-up FY 2001 OYB • Submission appropriations • October OMB Reviews New Appropriation Set FY 2002 OYB of 2003 request Bill on Continuing 653 (a) report • Resolution • November FY 2003 OMB Implement FY 2002 OYB • Passback • December FY 2003 appeal and Implement FY 2002 OYB • President’s Mark. • Begin FY 2003 CBJ • * Note: These time frames reflect the ideal, but may be adjusted to reflect reality.
Total Funding for PHN Sector FY 1997-2001 (in millions of dollars) - all accounts *UNICEF is funded in the by State IO account in 2003 **Includes Vulnerable Children
Population, Health and Nutrition FY 2003 - All Accounts Child Survival/ Maternal Health Family Planning/ 22% Reproductive Health 27% Vulnerable Children 1% Other Infectious Diseases 8% HIV/AIDS 42% Total= 1.55 Billion
Setting Region andCountry Levels • Mission requests, within parameters (based on history) • Congress sets some country levels (impacts on other countries) • State sets ESF, FSA, and AEEB country levels • Some broad strategic input (largely at the regional level) • Country levels are not always driven by strategic choices
FY 2001 PHN Funding by Region AFR (23 countries) $355 30% ANE (16 countries) $282 24% Central Programs $351 29% 13% 6% LAC (14 countries) $154 E&E (14 countries) $66
Field Support/ MAARDS $362 million Central Bureaus$351 million Region Missions $593 million PHNSector Budget Allocation FY 2001
HIV/AIDS BudgetFY 2000 Total Budget: $126 million Global Managed* 57% Mission Managed** 43% *Global managed includes central CA expenditures incurred via long-term technical assistance; sub-agreements; equipment, supplies, commodities, publications used in-country; training for host country participants; and total condom shipments for HIV/AIDS prevention. Field support provided by Missions to G/PHN is included under global managed.. **Some mission-managed HIV/AIDS activities may be directly financed by missions through grants and contracts with US-based cooperating agencies.
HIV/AIDS Expendituresthrough Central Cooperating AgenciesFY 2000 Total expenditures: $73 million In-Country Expenditures = 58% 31% 11% Global leadership, research, direct and indirect costs. Short-term TA & US-based staff time dedicated to supporting specific country programs Other 42% *Central CAs include: Expenditures incurred via long-term technical assistance; sub-agreements; equipment, supplies, commodities, publications used in-country; training for host country participants; and total condom shipments for HIV/AIDS prevention. Field support is reported under central cooperating agencies.