Download
1 / 23
230 likes | 317 Views
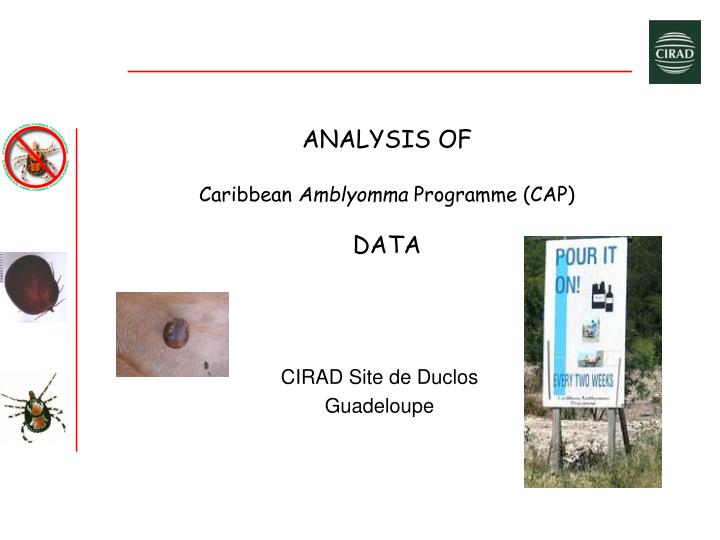
ANALYSIS OF Caribbean Amblyomma Programme (CAP) DATA. CIRAD Site de Duclos Guadeloupe. Introduction. CAP : eradication of Amblyomma variegatum (TBT) Field activities starting date: 1995 Change in the programme: 2007 Assess eradication activities efficacy

E N D
ANALYSIS OFCaribbean Amblyomma Programme (CAP)DATA CIRAD Site de Duclos Guadeloupe
Introduction CAP : eradication of Amblyomma variegatum (TBT) Field activities starting date: 1995 Change in the programme: 2007 • Assess eradication activities efficacy Foresee the consequences of ending eradication activities : risk analysis based on epidemiological data collected during 10 years
Background • Presence of TBT in the Carribean • CAP - Detailed objectives • Materials et methods • First results • Nevis • Discussion and perspectives
Amblyomma variegatum:Tropical Bont Tick • Brought during the 18th century • Spread throughout the Caribbean • Vector of cowdriosis • Associated to dermatophilosis Threat to livestock production development Risk of spread to Americain mainland
Carribean Amblyomma Programme CAP : International programme Starting date : 1994 Fundings : USDA, FAO, UE, IICA – Lesser Antilles • Treatment • Bayticol • Break the reproduction cycle by treating every 2 weeks • During 2 years 2)Monitoring and surveillance Examination of animals in randomly chosen farms every quarter Collection of surveillance data in TickInfo
Objectives of analysis • Correlations : • Treatment • Host specie Management and production Type of production (milk, meat) • Stray animals, fenced farms, mixed population, herd size… • Quarter • Environment Climat, vegetation, landuse, humidity • =>biomes • => Geographical analysis (GIS) Assess eradication activities efficacy: Did the prevalence decreased ? Risk analysis Consequences of changes in CAP activities Recommendations Increase control/surveillance activities effectiveness
Materials :TickInfo Available informations Visit date Farm location (province, farm) and contact ID Treatment Animals in visited farm Examined animals Ticks (gender, host specie) Dermatophilosis St Kitts, Nevis, St Lucia, Barbados Dominique, Antigua Other island: qualitive analysis
Methods I - REVIEW QUALITY OF DATA II - REVIEW QUANTITY OF DATA COLLECTED AMONG THE SURVEILLANCE PERIOD III - EVOLUTION OF ANIMAL/FARM PREVALENCE AMONG THE PERIOD IV - CORRELATION WITH PARAMETERS AVAILABLE R
Results I - REVIEW QUALITY OF SURVEILLANCE DATA 1) Errors in data • Examined animals > Animals in visited farm • Positive farm without any animal registered • Nevis 0.4% visits – Barbados : 1.6 % 2) Surveillance procedure not properly followed • 2 visits by quarter in the same farm and different data collected on animals => Duplicates : Nevis 10% visits – Barbados : 8% 3) Unavailable informations • Treatment status, farm location (GPS) • Livestock data : no recent census =>no denominator • Information never collected in TickInfo: data on management and production
Results : Nevis II - REVIEW QUANTITY OF SURVEILLANCE DATA:FARM AND ANIMAL LEVEL FARM ANIMAL
Results (2): Nevis II - REVIEW QUANTITY OF SURVEILLANCE DATA :ANIMAL LEVEL
Results: Nevis III - EVOLUTION OF PREVALENCE: TICK LEVEL
Results: Nevis III - EVOLUTION OF PREVALENCE: FARM & ANIMAL LEVEL
Results: Nevis III - EVOLUTION OF PREVALENCE: FARM & ANIMAL LEVEL
Results: Nevis IV - CORRELATION WITH PARAMETERS AVAILABLE Year + Quarter + Host specie + Parish
Errors in data ? Set of data • Send an error file to countries for correction • Data not Corrected and duplicates: delete / conserve them Ask for information about herd management for positive farms Livestock census: estimation from CVOs GIS data : maps of climate, vegetation … n databases n analysis n results Compare indicators Influence of erratic data on results
Perspectives RISK FACTORS • Modelise tick population evolution in the Carribean • Population genetic study (time and geographical evolution) • Pathogen population and genetic dynamique
Bilan • Correlations : • Treatment • Host specie Management and production Type of production (milk, meat) • Stray animals, fenced farms, mixed population, herd size… • Quarter • Environment Climat, vegetation, landuse, humidity • =>ecozones • => Geographical analysis (GIS) Assess eradication activities efficacy: Did the prevalence decreased ? Risk analysis Consequences of ending CAP activities Recommendations Increase control/surveillance activities efficacy