Download
1 / 33
330 likes | 561 Views
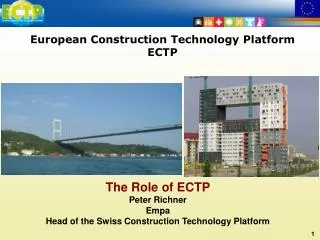
EUROPEAN CONSTRUCTION CONFERENCE 2008 WESTERN EUROPE CONSTRUCTION. Gerard O Sullivan FRICS FSCS president CEEC DUBLIN JANUARY 2008. AGENDA CEEC brief introduction who are we? what do we do? Current projects! events 2. European Construction –comparisons /trends 2006/2007

E N D
EUROPEAN CONSTRUCTION CONFERENCE2008WESTERN EUROPE CONSTRUCTION Gerard O Sullivan FRICS FSCS president CEEC DUBLIN JANUARY 2008 CEEC /mmp
AGENDA • CEEC brief introduction who are we? what do we do? Current projects! events 2. European Construction –comparisons /trends 2006/2007 • European construction industry 2006 –year of growth • Performers -The top 5 • The middle ranking • the new guys • Germany-briefing • Spain-briefing • France -briefing • Some Middles rankers,Denmark-Netherland-Finland -Belgium-Poland 7. Conclusion CEEC /mmp
CEEC MEMBERS Representative Forum for European National Institutions for Construction Economics Professionals. • Belgium Union Belge des Quantity Surveyors • Denmark Danish Association of Construction Economists • Finland Association of construction economists Finland RAKI • France Union Nationale des Economists de la Construction et Coordonnateurs UNTEC • Ireland The Society of Chartered Surveyors • Holland Nederlandse Vereniging Van Bouwkostendeskundigen NVBK • Spain Consejo General de la Arquiectura Tecnica de Espana CGATE • Switzerland Swiss Professional Association for Construction Economists • UK The Royal Institution of Chartered Surveyors • Full Membership pending Poland and Czech Republic • Individual members – Germany, Poland, Rumania CEEC /mmp
Objectives • Promote the construction economist and the service they provide • Represent the interests to EU Institutions and other bodied • Promote education, training and qualification standards • Establish common Professional Codes of Practice • Google – ceecorg.eu CEEC /mmp
PROJECTS • Infrastructure cost planning survey • Code of Measurement • Steel Price Book for German Construction • Office Cost Model • Professional Construction Economists-Standard European self assessment model CEEC /mmp
Working in EUROPE KEY ISSUES • Registration of professions • Limited cross border trading • Language differences • Contractual differences –France-Germany • Construction cultures –eg Steel not popular in Germany • Preponderance of small SMEs CEEC /mmp
Legal system –codified law • Insurance – French project insurance restricts access • National and local construction culture-socialism-cronyism • Labour shortages • Local regulations • Lack of EU conformity CEEC /mmp
EUROPEAN CONSTRUCTION • European Construction 2006 key figures • Investment (EU -27+2) – 1,258 billion • 10.4% of GDP (EU27) • 50.5% of Gross fixed Capital Formation • 2.8 million enterprises (93% Sees < 10) • 15.7 million operatives • (EU 27-7.2% Europe’s total employment/30.4% of industrial employment) • 26 million dependent workers • Source FIEC report 2007 CEEC /mmp
EUROPEAN CONSTRUCTION BREAKDOWN • NON RESIDENTIAL 30% • HOUSEBUILDING27% • REFURBISHMENT/MAINTENANCE 23% • CIVIL ENGINEERING 20% • INTERNATIONAL ACTIVITY 44 BILLION • SOURCE FIEC REPORT 2007 CEEC /mmp
The Major Players • GROSS INVEST JOBS NO ENTERPRISES BILLION € X 1000 X1000 • GERMANY 216 18% 2,156 14% 227 av. 9.5p/e • SPAIN 186 15.5% 2,546 16.5% 448 av.5.4p/e • UK 166 14% 1,822 12% 209 av.8.7p/e • FRANCE 151 12.6% 1,798 11.8% 315 av.5.7p/e • ITALY 144 12% 1,900 12.4% 563 av.3.7p/e • SOURCES FIEC REPORT 2007 CEEC /mmp
The Major Players • 72% of investment • 67.7% of employment • 64% of the enterprises • Average size of enterprise 5.8 persons CEEC /mmp
THE MIDDLE RANKS GROSS INVEST JOBS NO ENTERPRISES BILLION € X 1000 X1000 NETHERLANDS 52 4.3% 445 2.9% 82 av. 5.4 p/e IRELAND 36 3% 260 1.7% 10 av.26 p/e BELGIUM 29 2.4% 248 1.6% 71 av. 3.5 p/e DENMARK 29 2.4% 180 1.1% 29 av. 6.2 p/e AUSTRIA 29 2.4% 257 1.7% 24 av.10.7 p/e POLAND 26 2.1% 690 4.5% 113 av. 6.1 p/e FINLAND 24 2% 270 1.0% 32 av.5.0 p/e SWEDEN 21 1.7% 248 1.8% 61 av. 4.4 p/e PORTUGAL 19 1.6% 551 3.6% 113 av. 4.8 p/e GREECE 16 1.3% 300 2.0% 108 av. 2.8 p/e LUXEMBOURG 3 0.3% 30 0.2% 2 av. 15 p/e SWITZERLAND 32 275 36 av.7.6 p/e NORWAY 30 187 37 av.5.0 p/e SOURCES FIEC REPORT 2007 CEEC /mmp
THE MIDDLE RANKS • 23% of investment • 22% of employment • 23% of the enterprises • Average size of enterprise 5.3 persons CEEC /mmp
THE NEW GUYS GROSS INVEST JOBS NO ENTERPRISES • 11 BILLION € X 1000 X1000 • HUNGARY 11 0.9% 325 2.1% 72 av. 4.5 p/e • CZECH REP 10 0.8% 363 2.4% 150 av.2.4 p/e • ROMANIA 8 0.7% 380 2.5% 250 av. 1.5 p/e • SLOVAKIA 5 0.4% 156 1.0% 3 av. 52 p/e • SLOVENIA 3 0.25% 71 0.5% 13 av.5.5 p/e • BULGARIA 3 0.25% 150 1.0% 10 av. 15 p/e • BALTIC STATES 7 0.6% 189* 1.2% 9 av.21 p/e • CYPRUS 1 0.1% 38 0.25% 5 av. 7.6 p/e • MALTA 1 0.1% 12 0.1% NA CEEC /mmp
THE NEW GUYS 5% of investment • 10.3 % of employment • 13% of the enterprises • Average size of enterprise 3.3 persons CEEC /mmp
GERMANY • (p schmid ceec germany) • VOLUME CONSTRUCTION WORKS COMMERCIAL • +2% 2007 • +3% FORECAST 2008 • INFRASTRUCTURE INCREASE • RESIDENTIAL VOLUME GOING DOWN –END CO-FINANCING WITH PRIVATE PROPERTIES CEEC /mmp
GERMANY • CONSTRUCTION COSTS • 2006 4Q -2007 4Q 6.4% • SOURCE BUNDESBANK • MATERIAL COSTS 10% 2006 • VAT PRIVATE WORKS 16% TO 19% IN 2007 • STEEL RISE 5% 2008 • EAST LAGGING BY 10% • RIGID MARKET CEEC /mmp
GERMANY • PROPERTY • Market for investors-retail, residential, offices increasing value –too few properties on market -up to 15 times • Key cities • Hamburg and Munich –attractive – prosperous economies –interesting cities –projects Hafen City-Airport Extension-New Central Station • Frankfurt –banking centre-new high rise • Berlin –stand by role – major renovations public buildings- embassy row – left wing government not convincing –new airport Schoenfeld • Stuttgart 21 -new central station –major tunnelling project • OUTLOOK not bad- no extremes • P Schmid - CEEC /mmp
SPAIN • SECOND LARGEST INVESTMENT IN EUROPE • KEY CITIES –MADRID -4 TOWERS • BARCELONA –VALENCIA-COAST • TRENDS FOR FIRST 10 MONTHS UP ON 2006 CEEC /mmp
FRANCE (UNTEC/CEEC) • CONSTRUCTION OUTPUT 2007 • Year on year • Authorised -0.2% • Notified starts +6.2% • Last 3 months • Authorised -10.3% • Notified Starts -2.8% CEEC /mmp
FRANCE • CONSTRUCTION JAN 2008 • Building type 3 month % annual % • Offices authorised 1433.7 -12 6019.8 8.3 • Offices starts 1026.0 -6.5 4477.8 7.6 • Commercial auth. 1535.8 5.6 5896.6 -1.0 • Commercial start 1037.4 -18.9 4714.9 1.3 • Industrial auth. 2726.4 2.9 11129.8 8.2 • Industrial start 2242.1 30.3 `8868.2 11.3 CEEC /mmp
FRANCE • Construction Jan 2008 • Building type 3 month % annual % • Warehouses Auth 1066.4 19.3 3894.9 3.9 • Warehouse start 705.3 11.3 3045.5 12.9 • Agriculture auth. 2276.4 -26.6 13578.6 -3.2 • Agriculture start 2262.9 - 7.0 11307.4 -0.3 • Hotels etc auth. 268.5 8.6 873.6 -0.7 • Hotels start 171.9 13.3 647.4 20.4 CEEC /mmp
FRANCE • Construction Jan 2008 • Building type 3 month % annual % • Educational auth 566.0 -27.3 2408.6 -7.3 • Educational start 492.3 -9.6 2089.2 8.6 • Health auth. 959.0 -18.4 3765.7 -11.0 • Health start 757.0 - 21.6 3446.4 14.5 • Culture etc auth. 593.3 -24.7 2381.8 -9.6 • Culture start 475.5 -23.2 2198.3 -4.1 • Source SESP Ministre de L ‘ecologie ,du Developpement et de l’Amenagement durables CEEC /mmp
FRANCE • Regions -% change year on year • authorisations starts • Alsace (19/21) 30.0 -6.8 • Nord /Pas de Calais(7/21) 14.2 4.5 • Haut Normandie(17/21) 11.6 44.2 • Ile de france (1/21) -3.5 1.9 • Provence (9/21) -14.9 -18.5 • Bretagne (4/21) 8.3 14.9 CEEC /mmp
some middle rankers • Netherlands • Rotterdam,De Hague • High rise • Strong growth but see Belgium CEEC /mmp
some middle rankers • Denmark • Confidence indicators down 2007 from jan to dec – 22 to 4 • Prices dropping 4 to -7 • Stock orders 30-7 • 6.7 % costs up CEEC /mmp
Some middle rankers • FINLAND • Key indicators 2006 2007 2008 forecast Construction vol. change 3.3% 5.0% 3.0% Building 3.2% 6.0% 3.0% Renovation 3.5% 3.0% 3.0% Engineering 3.7% 4.0% 3.0% Building Start,Mill cum 43.3 48.0 42.5 House starts 000’s 34 32 31 Building Cost Index % change 3.8 6.0 4.0
some middle rankers • BELGIUM • The year 2006 has been one the best years for the Belgian economy and the growth, in comparison with 2005, is approximately +2,5 %. • The increase of the PIB (Produit Intéieur Brut) has been of 2,9 % compared to the european average of 2,8 %. • The inflation rate was +2,3 % compared to the European average of 2,2 %. • The construction represents about 5 % of the P.I.B. • There is an increase of the non residential constructions and it is anticipated to have a decrease of the public investments of approx. -10 %. • However, there are a few huge projects such as extensions of the infrastructure for high speed trains and connection to the airport. • The increase of the materials costs have lead to the increase of the construction costs and the construction sector is facing a lack of qualified labour. CEEC /mmp
BELGIUM • According to the “Annual Report – Construction” issued by the Confédération de la Construction, the breakdown of the figures in the construction sector is the following • Residential – new construction : 20 % • Residential – refurbishment : 24 % • Non residential – refurbishment : 15 % • Non residential – new construction : 23 % • Civil works : 18 % • According to the last information it appears that in the residential sector, there is a significant increase of the refurbishment works and a decrease of the new constructions. The forecast for 2007 is a significant decrease of the activities in the construction sector. • SOURCE WIDNELL –christian deprez – belgian QSs CEEC /mmp
Poland • Report from Warsaw • Offices in prime cities –Warsaw,( reserve office space down to 2.55%) Tri City , Poznan ,Lodz,Wroclaw,Krakow.Katowice - • Residential –decreasing trend • Public works –Poland ranked 156th for efficiency in granting building permits • Retail booming CEEC /mmp
Poland • Cost materials decreased – overall 8% • Labour increasing –up 12-15% • SKILL TRADES +25% • PROJECTS –ALL LATE – EURO STATDIUM, WARSAW AIRPORT, NEW BUDGET AIRPORT,RESIDENTIAL TOWERS • Source Adam Grabski –Polish CEEC rep CEEC /mmp
CONCLUSION • AFTER RECORD YEAR OF 2006 TREND CAN ONLY BE ONE WAY • WEST MAY BE SLOWING • MIDDLE RANKERS –SOME MAY BUCK TREND • DON’T UNDER ESTIMATE DIFFICULTIES AND CULTURE DIFFERENCES • EAST HAS TO KICK OFF AND HAS A LOT OF CATCH UP TO DO • NEEDS TO DISCOVER WEST ERN EFFICIENCIES AND LOOSE LABOUR INTENSIVE OUTLOOK CEEC /mmp