Download
1 / 62
620 likes | 815 Views
Fast-ion D (FIDA) Measurements of the Fast-ion Distribution Function. Bill Heidbrink DIII-D Instruments Keith Burrell, Yadong Luo, Chris Muscatello, Brian Grierson NSTX Instruments Ron Bell, Mario Podestà Two-dimensional imaging Mike Van Zeeland, Jonathan Yu ASDEX Upgrade Instruments

E N D
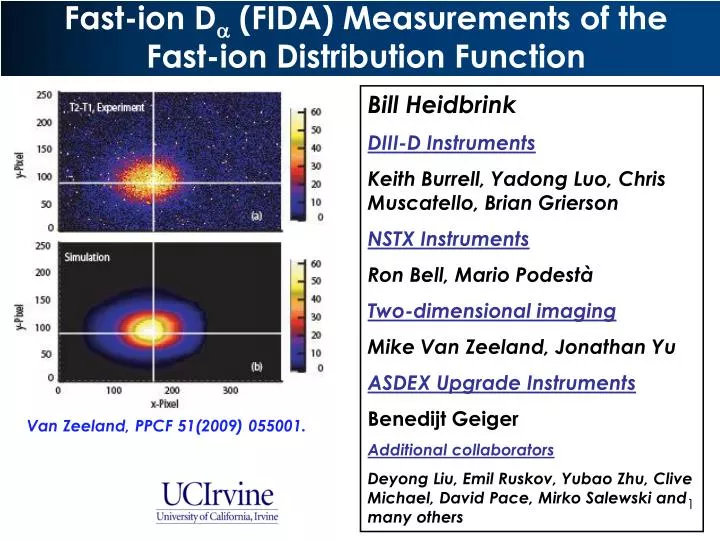
Fast-ion D (FIDA) Measurements of the Fast-ion Distribution Function Bill Heidbrink DIII-D Instruments Keith Burrell, Yadong Luo, Chris Muscatello, Brian Grierson NSTX Instruments Ron Bell, Mario Podestà Two-dimensional imaging Mike Van Zeeland, Jonathan Yu ASDEX Upgrade Instruments Benedijt Geiger Additional collaborators Deyong Liu, Emil Ruskov, Yubao Zhu, Clive Michael, David Pace, Mirko Salewski and many others Van Zeeland, PPCF 51(2009) 055001.
Why Measure the Fast-ion Distribution Function? • The distribution function F(E,pitch,R,z) is a complicated function in phase space • Fast ions are major sources of heat and momentum. needed to understand transport & stability • They drive instabilities that can expel fast ions and cause damage
Outline • What is FIDA? How do we distinguish the FIDA light from all the other sources? • How does the FIDA signal relate to the fast-ion distribution function? Is our interpretation correct? • What are the applications? • What are the practical challenges? (New section) • How can we check the results? (New section) Slides in first three sections are from my 2010 HTPD invited talk: Rev. Sci. Instrum. 81 (2010) 10D727
FIDA is an application of Charge Exchange Recombination Spectroscopy 3 cm • The fast ion exchanges an electron with an injected neutral • Neutrals in the n=3 state relax to an equilibrium population; some radiate • The Doppler shift of the emitted photon depends on a component of the fast-ion velocity
FIDA is Charge Exchange Recombination Spectroscopy--with a twist • The radiating atom is a neutral no plume effect • The fast ion distribution function is very complicated need more than moments of the distribution • The Doppler shift is large low spectral resolution OK for FIDA feature but good resolution desirable anyway • Many sources of bright interference like a laser scattering measurement
Bright interfering sources are a challenge • D light from injected, halo, and edge neutrals • Visible bremsstrahlung • Impurity lines Luo, RSI 78 (2007) 033505
Background Subtraction Normally Determines the Signal:Noise T = F + Fedge+ V + Icx + Incx + Dcold + Dinj + Dhalo (red only appears w/ beam) T = Total signal F = Active Fast-ion signal (the desired quantity) Fedge= FIDA light from edge neutrals V = Visible bremsstrahlung Icx = Impurity charge-exchange lines Incx = Impurity non-charge-exchange lines Dcold = Scattered Da light from edge neutrals Dinj = Da light from injected neutrals (beam emission) Dhalo = Da light from halo neutrals
Must measure all other sources for an accurate FIDA measurement T = F + V + Icx + Incx + Dcold + Dinj + Dhalo T = Total signal F = Fast-ion signal V = Visible bremsstrahlung Icx = Impurity CX (Fit to remove) Incx = Impurity non-CX Dcold = Cold Da(Measure attenuated cold line) Dinj = Injected Da(Try to measure) Use “Beam-off” measurements to eliminate black terms Heidbrink, RSI 79 (2008) 10E520
Must extract the FIDA signal from the background • Used beam modulation for background subtraction • Can use a toroidally displaced view that misses the beam • Fit the entire spectrum (all sources) NSTX Background subtraction via beam modulation works in a temporally stationary plasma; an equivalent view that misses the beam works if the plasma is spatially uniform.
Two main types of FIDA instruments: spectrometer or bandpass-filtered Tune to one side of the D line
Two main types of FIDA instruments: spectrometer or bandpass-filtered Measure full spectrum but block (attenuate) D line Luo, RSI 78 (2007) 033505
Two main types of FIDA instruments: spectrometer or bandpass-filtered Measure one side but attenuate D line Heidbrink, RSI 79 (2008) 10E520
Two main types of FIDA instruments: spectrometer or bandpass-filtered Bandpass filter one side of the spectrum or CCD Podestà, RSI 79 (2008) 10E521.
FIDA imaging: Put bandpass filter in front of a camera • Oppositely directed fast ions from counter beam produces blue-shifted light (accepted by filter) • “Imaging” neutral beam produces red-shifted light (filtered out) Van Zeeland, PPCF 51(2009) 055001.
Photograph of an ASDEX-U instrument grating (2000 l/mm) Interference filter Princeton Instruments EMCCD camera 180mm lenses f2.8 Geiger grating (2000 l/mm)
Outline • FIDA is charge-exchange recombination light that is Doppler-shifted away from other bright D sources. • How does the FIDA signal relate to the fast-ion distribution function? Is our interpretation correct? • What are the applications? • What are the practical challenges? • How can we check the results?
The “weight function” describes the portion of phase space measured by a diagnostic • Define a “weight function” in phase space • Like an “instrument function” for spectroscopy • Doppler shift only determines one velocity component energy & pitch not uniquely determined Heidbrink, PPCF 49 (2007) 1457
Different Toroidal Angles Weight Velocity Space Differently R0 V2 V2 In this case, get much more signal from a view with a toroidal component of 0.6.
|vperp|, vll are the best coordinates to use 10o 45o 100o 80o V2 V2 Salewski, NF 51 (2011) 083014
Ideal views give information about both |vperp| and vll R0 • Imagine a population at a single point in |vperp|, vll space • Shift gives information about vll • Spread gives information about vperp V2 V2 Ideal views are shifted by ~15o from 0o or 90o Salewski, NF 51 (2011) 083014
The “weight function” concept explains many results Luo, RSI 78 (2007) 033505 • Changing Te changes NPA signal more than FIDA signal • NPA measures a “point” in velocity space; FIDA averages • More pitch-angle scattering at larger Te
Use Forward Modeling to Simulate the Signal • Forward modeling using a theory-based distribution function from TRANSP, …. • Machine-specific subroutines for beam & detector geometry • Data input: files with plasma parameters mapped onto flux coordinates • Compute neutral densities of injected beam & halo • Weighted Monte Carlo computes neutralization probability, collisional-radiative transitions, and spectra R0 V2 V2 FIDASIM code is available for download Heidbrink, Comm. Comp. Phys. (2010)
FIDASIM models FIDA, beam-emission, thermal, and VB features R0 V2 We plan to maintain a public version of Geiger’s Fortran90 FIDASIM V2 Heidbrink, Comm. Comp. Phys. (2010)
Excellent Results were Obtained with the First Dedicated Instrument • Studied quiet plasmas first where theoretical fast-ion distribution function is known • Spectral shape & magnitude agree with theory • Relative changes in spatial profile agree with theory • Dependence on injection energy, injection angle, viewing angle, beam power, Te, & ne all make sense • Consistent with neutrons & NPA Luo, Phys. Pl. 14 (2007) 112503.
FIDA image agrees with theory • One normalization in this comparison Van Zeeland, PPCF 51(2009) 055001.
Outline • FIDA is charge-exchange recombination light that is Doppler-shifted away from other bright D sources. • FIDA measures one velocity component of the fast-ion distribution function. Measurements in MHD-quiescent plasmas are consistent with theoretical predictions. • What are the applications? • What are the practical challenges? • How can we check the results?
Type 1: Relative change in spectra • Average over time windows of interest • Discard time points with contaminated background • This example: ion cyclotron acceleration of beam ions Heidbrink, PPCF 49 (2007) 1457.
High-harmonic heating in a spherical tokamak produces a broader profile than in DIII-D • Many resonance layers in NSTX • Very large gyroradius Heidbrink, PPCF 49 (2007) 1457. Liu, PPCF 52 (2010) 025006.
Type 2: Relative change in time evolution • Integrate over range of wavelengths • Divide integrated signal by neutral density “FIDA density” • This example: Alfvén eigenmode activity is altered by Electron Cyclotron Heating (ECH); weaker modes better confinement Van Zeeland, PPCF 50 (2008) 035009.
Severe Flattening of Fast-ion Profile Measured during Alfven Eigenmodes • Corroborated by neutron, current profile, toroidal rotation, and pressure profile measurements • Spectral shape hardly distorted Heidbrink, PRL 99 (2007) 245002; NF 48 (2008) 084001.
TAE “Avalanches” in NSTX: Mode overlap & enhanced fast-ion transport • Measure local drop in fast-ion density at MHD event using bandpass filter • Fluctuations at mode frequency observed in sharp gradient region Magnetics Podestà, Phys. Pl. 16 (2009) 056104.
View same radius from different angles to distinguish response of different orbit types R0 V2 Vertical Beams Tangential V2 Muscatello, PPCF 54 (2012) 025006 Heidbrink RSI 79 (2008) 10E520. • Vertical view most sensitive to “trapped” ions • Tangential view most sensitive to “passing” ions • “Sawtooth” crash rearranges field in plasma center • Passing ions most affected, as predicted by theory
Type 3: Absolute Comparison with Theory • Integrate over time window of interest • Use calibration to get absolute radiance • For profile, also integrate over wavelengths • Compute theoretical spectra and profile • This example: drift-wave turbulence in high temperature plasma causes large fast-ion transport Heidbrink PRL 103 (2009) 175001; PPCF 51 (2009) 125001
Microturbulence causes fast-ion transport when E/T (energy/temperature) is small • Small MHD or fast-ion driven modes • Co-tangential off-axis injection • Low power case in good agreement at small minor radius but discrepant at low Doppler shift (low energy) • High power case discrepant everywhere Heidbrink PRL 103 (2009) 175001; PPCF 51 (2009) 125001
More recent microturbulence data finds negligible transport • No MHD or fast-ion driven modes • Well-diagnosed plasmas • Spectra & profile consistent with classical predictions for several cases Pace, PoP (2013) in preparation
LHD TEXTOR Beam emission Osakabe, RSI 79 (2008) 10E519. Delabie RSI 79 (2008) 10E522. ASDEX-U MAST FIDA emission Geiger (2010) private communication. Michael (2010) private communication. FIDA diagnostics are implemented worldwide
FIDA is a powerful diagnostic of the fast-ion distribution function • Spectral information one velocity coordinate • Spatial resolution of a few centimeters • By integrating light over the wing, get sub-millisecond temporal resolution • With spectral integration, get two-dimensional images • Radiance absolute comparisons with theory • Highlights of applications to date • Confirm TRANSP predictions in MHD-quiescent plasmas • Measure RF acceleration of fast ions • Diagnose transport by Alfven eigenmodes • Measure fast-ion transport by microturbulence
Outline • FIDA is charge-exchange recombination light that is Doppler-shifted away from other bright D sources. • 2. FIDA measures one velocity component of the fast-ion distribution function. Measurements in MHD-quiescent plasmas are consistent with theoretical predictions. • 3. FIDA measures transport by instabilities and acceleration by ICRH • 4. What are the main practical challenges? • 5. How can we check our results?
Bright interfering sources present two challenges • Separate FIDA feature from other features • Large dynamic range of signal edge D-alpha Beam emission 60keV 90keV CII HeI FIDA Geiger, Plasma Phys. Cont. Fusion 53 (2011) 065010 Beam emission
Initial (obsolete) approach: Avoid beam emission • Filter or avoid the cold D line • Spectral intensity of injected neutral light is ~100 times brighter • A vertical view works Heidbrink, PPCF 46 (2004) 1855
Better approach: measure beam emission • FIDA ~ ninj nf • Infer ninj from beam emission • arrange viewing geometry to measure both Grierson RSI (2012) 10D529
Background Problem: Scattered Da Contaminates Signal & Changes in Time • Normal data analysis • Remove impurity lines • Subtract background (from beam-off time) • Average over pixels to obtain FIDA(t) The problem: impurity and scattered D light change! (Careless) Normal Analysis says fast ions “bounce back” after sawtooth crash This is wrong! Luo, RSI 78 (2007) 033505
Four approaches to the very bright cold line NameSpectrometerCameraCold D NSTX vertical1 Holospec Photonmax ND filter D3D vertical2 Czerny-Turner Sarnoff blue-side only D3D oblique3 Holospec Sarnoff blue-side w/ filter D3D main ion4 Czerny-Turner Sarnoff mild saturation 1Podestà, RSI 79 (2008) 10E521. 2Luo, RSI 78 (2007) 033505. 3Muscatello, RSI 81 (2010) 10D316. 4Grierson, Phys. Pl. 19 (2012) 056107.
NSTX has both active and passive views Vertical view Top view NB line: B 44
Raw data show FIDA feature • Compare “beam-on” and “beam-off” spectra from adjacent time bins • FIDA feature evident from magnetic axis to outer edge on active channels • Spectra include impurity lines 45
Example of successful & unsuccessful background subtraction • Net spectra should go to zero at large Doppler shifts • Should get same spectra from beam modulation (“beam on – beam off”) & reference view (“active view – passive view) • Beam modulation spectra for reference view shouldbe flat and ~ zero. • Blue-shifted spectra meet criteria for this case • Red-shifted spectra do not 46
Background offsets are caused by scattering of the bright central line • Measure modulated spectra (“beam on – beam off”) in three bands: Large blue shift (above injection energy), cold D line*, Large red shift • Compile database for 11 times in 9 shots • Strong correlations for all channels for both red and blue sides of spectra Amplitude *includes some beam emission 47
Cold D line causes problems • Avoid views with large recycling • Ideal detector solution: narrow notch filter that attenuates cold line • Holospec transmission grating spectrometer has high throughput but more scattered light • Want to measure full spectrum • No filter (Grierson) causes detector saturation NSTX solution sees scattered light
Collisions with edge neutrals produce FIDA light DIII-D example during off-axis fishbones • Existing FIDA diagnostics use active emission from an injected neutral beam • Passive emission is observed when fast ions pass through the high-neutral density region at the plasma edge* • For strong instabilities, the passive FIDA light is stronger than beam emission! *Heidbrink, PPCF 53 (2011) 085007
Outline • FIDA is charge-exchange recombination light that is Doppler-shifted away from other bright D sources. • 2. FIDA measures one velocity component of the fast-ion distribution function. Measurements in MHD-quiescent plasmas are consistent with theoretical predictions. • 3. FIDA measures transport by instabilities and acceleration by ICRH • 4.The cold D line and varying backgrounds are major challenges • 5.How can we check our results?