Download
1 / 29
300 likes | 566 Views
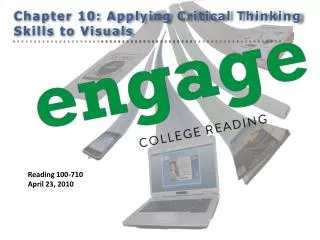
Chapter 10: Applying Critical Thinking Skills to Visuals . Reading 100-710 April 23, 2010. Tonight. Turn in Chapter 9 quiz Discussing “Applying Critical Thinking Skills to Visuals” Discuss the Holocaust of WWII. Wednesday . Make sure that projects are emailed to me no later than 6:30 pm.

E N D
Chapter 10: Applying Critical Thinking Skills to Visuals Reading 100-710April 23, 2010
Tonight • Turn in Chapter 9 quiz • Discussing “Applying Critical Thinking Skills to Visuals” • Discuss the Holocaust of WWII
Wednesday • Make sure that projects are emailed to me no later than 6:30 pm. • Continue working on last of the Aplia assignments • We will discuss final assignments and final exam.
Visuals Are Important Visuals in textbooks may provide • Examples of the ideas being talked about • Specific numerical data to support the general statements in the text • A comparison of large amounts of information.
Read the title carefully Basic Rules for Interpreting Graphs and Tables • Read the headings of rows/columns or x/y axes carefully • If different colors are used, notice their meaning • Think critically about the implications of the headings, the numbers, and the way the information is presented.
Interpret Tables • A table is an arrangement of information in rows and columns. • Tables condense a lot of information into a small space, and they make pieces of information easy to compare. • Tables may be comprised of information reported in words or numbers.
Example Table This table (close-up on the next slide) has • a title • column headings • two major subgroups – fat-soluble and water-soluble vitamins.
Interpret Line Graphs • Line graphs are used to show how a condition or behavior changes over time. • The number of people engaging in a behavior is often plotted on the y-axis (the vertical line). • Units of time, such as years, are plotted on the x-axis, or horizontal line. • Line graphs make it easy to see trends in data.
Interpret Bar Graphs • Bar graphs help readers compare differences between two groups. • A bar graph can show the relationship between two sets of numbers, such as the number of people doing two different things over a certain number of years.
Interpret Pie Charts • A pie chart shows how a whole pie – 100% of something – is divided up. • Pie charts help readers compare the percentages or proportions of different components of a whole.
Example Pie Chart
Interpret Flowcharts • Flowcharts, also called process charts, show how different stages in a process are connected. • Read flowcharts from left to right and from top to bottom. • Flowcharts can be simple or quite technical with different boxes representing different aspects of the process.
Interpreting Photographs, Illustrations & Multimedia • Photographs are used in readings to illustrate the ideas being discussed. • Photograph captions connect the photo to the idea being illustrated and should be read just as carefully as the title of a chart, a graph, or a table. • Illustrations often require you to understand the “implied meaning” if there is limited text. • Multimedia can be a combination of video, audio, pictures, charts/graphs. Be aware of the theme.
Example Photos with Captions Schindler’s List/The Holocaust of WWII http://www.youtube.com/watch?v=slZMOkYJFO0&feature=related
Schindler and Leopold "Poldek" Pfefferberg As chance encounter between “Schindlerjuden” Pfefferberg and Thomas Keneally, at Pfefferberg’s leather goods store in Beverly Hills, was the beginning of the book Keneally was to write -- Schindler’s Ark, later was renamed as Schindler’s List.
Oskar Schindler 1908-1974 Emilie Schindler 1907-2001
Nazi Propaganda for Children • http://www.od43.com/Trust_No_Fox_RC.html
Book How to Explain the “German Question” to children in the classroom http://www.od43.com/Judenfrage_Unterricht_Fink.html
Ethnicity/Background of Persons Murdered in Holocaust(estimated)
MultiMedia • http://www.ushmm.org/museum/exhibit/online/flight_rescue/
Discussion Board Question Due • Ervin Staub, a Holocaust survivor from Hungary has written, "Goodness, like evil, often begins in small steps. Heroes evolve; they aren't born. Very often the rescuers make only a small commitment at the start, to hide someone for a day or two. But once they had taken that step, they began to see themselves differently, as someone who helps. What starts as mere willingness becomes intense involvement."