Download
1 / 29
290 likes | 527 Views
PLC and New Product Introductions. BA 6324: Fundamentals of Marketing Professor Dillon Lecture Notes: Set #5. PLC and New Product Introductions. 1. Product Life Cycle 2. Diffusion of Innovation New Product Introductions Forecasting New Product Introductions 5. Practice Problems. Sales.

E N D
PLC and New Product Introductions BA 6324: Fundamentals of Marketing Professor Dillon Lecture Notes: Set #5
PLC and New Product Introductions • 1. Product Life Cycle • 2. Diffusion of Innovation • New Product Introductions • Forecasting New Product Introductions • 5. Practice Problems
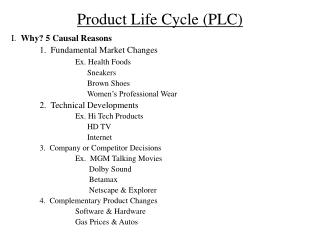
Sales Sales and Profits ($) Profit Growth Introduction Maturity Decline Time PLC and New Product Introductions 1. Product Life Cycle 1.1 Basic Form * All things have a beginning * Things grow * Things mature * Things die
400 300 200 100 0 All Liquor Sales (000,000s Gal.) White Goods Vodka Smirnoff Time (Year) PLC and New Product Introductions 1.1.1 Some Examples
Sales Volume Sales Volume Sales Volume Primary Cycle Recycle Time Time Time PLC and New Product Introductions 1.1.2 Alternative Forms (a) “Growth-slump-maturity” pattern (b) “Cycle-recycle” pattern (c) “Scalloped” pattern
Sales Maturity Introduction Growth Decline Time PLC and New Product Introductions 1.2 Prescriptions CHARACTERISTICS Sales Low sales Rapidly rising Peak sales Declining sales sales Costs High cost per Average cost Low cost per Low cost per customer per customer customer customer Profits Negative Rising High profits Declining profits profits Customers Innovators Early Middle Laggards adopters majority Competitors Few Growing Stable number Declining number beginning to number decline
Create product awareness and trial Maximize profit while defending market share Reduce expenditure and milk the brand Maximize market share Offer a basic product Diversity brands & models Phase out weak items Offer product extensions, service, warranty Product Price to match or best competitors Price to penetrate market Price Use cost-plus Cut price Build more intensive distribution Go selective: phase out unprofitable outlets Build intensive distribution Build selective distribution Distribution Stress brand differences & benefits Reduce to level needed to retain hardcore loyals Build product awareness among early adopters & dealers Build awareness & interest in the mass market Advertising Sales Promotion Reduce to take advantage of heavy consumer demand Use heavy sales promotion to entice trial Increase to encourage brand switching Reduce to minimal level PLC and New Product Introductions 1.3 Marketing Objectives STRATEGIES
Strategic Market Planning - Revenue Growth - Financial Performance - Strategic Market Position Offensive Marketing Strategies Defensive Marketing Strategies Protect or Reduce Focus Within Existing Markets Harvest or Divest Existing Markets Penetrate or Grow Existing Markets Enter or Develop New Markets Offensive vs. Defensive Strategic Marketing Plans Offensive/ Defensive Product Life Cycle and Offensive and Defensive Marketing Strategies Defensive Offensive/ Defensive Defensive Sales Revenue Offensive Offensive Offensive Emerging Market Early Growth Rapid Growth Late Growth Maturing Market Mature Market Declining Market PLC and New Product Introductions 1.4. And Relation to Offensive vs. Defensive Strategic Marketing Plans
PLC and New Product Introductions 2. Diffusion of Innovation 2.1 Stages in the Adoption Process 1. Awareness: The consumer becomes aware of the innovation but lacks information about it. 2. Interest: The consumer is stimulated to seek information about the innovations. 3. Evaluation: The consumer consider whether it would make sense to try the innovation. 4. Trial: The consumer tries the innovation on a small scale to improve his or her estimate of its value. 5. Adoption: The consumer decides to make full and regular use of the innovation.
2 1/2% Innovators 16% Laggards 13 1/2% Early adopters 34% Early Majority 34% Late Majority X - 2 X - X + X PLC and New Product Introductions 2.1.1 Adopter Categorization-Relative Time of Adoption
Laggards 16% Late Majority 34% Percentage of Adopters Early Majority 34% Early adopters 13 1/2% Innovators 2 1/2% t1 t2 t3 t4 PLC and New Product Introductions 2.2 Adoption/Diffusion Process
PLC and New Product Introductions 2.3 Influence of Product Characteristics on The Rate of Adoption 1. Relative Advantage- degree to which new product appears superior to existing products. 2. Compatibility-degree to which new product matches the values and experiences of the individuals in the community. 3. Complexity- degree to which new product is relatively difficult to understand or use. 4.Divisibility- degree to which new product may be tried. 5. Communicability- degree to which the new product can be seen or talked about 6. Initial Costs- sum of all costs associated with acquiring the new product. 7. Risk/Uncertainty- sum of all emotional and performance risks. 8. Scientific Credibility- degree to which new product claims are backed up by evidence. 9.Social Approval- rate of adoption
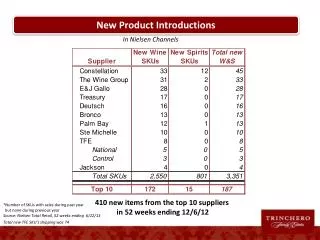
PLC and New Product Introductions 3. New Product Introduction 3.1 Why Introduce New Products LOVE HATE RELATIONSHIP - LOVE 1. profits 2. cash flow 3. possibility to extend PLC 4. consistency Strategic Reasons - HATE 1. failure rates (as high as 60%) 2. consumes resources (46% resources wasted) 3. cost * Consumer Products 6.3 - 28 million * Industrial Products 1.8 - 18.2 million 3.2 New Product Activity: Rapid Proliferation of New Products > 1970: 7,800 SKU’s carried in grocery stores > 1990’s 17,901 SKU’s - today over 30,000 > Over 13,000 new product introductions not uncommon
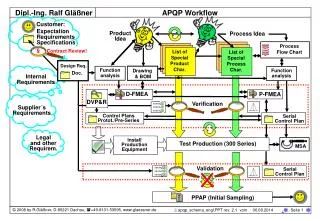
Plan Reality Recognition Design Evaluation Selection Implementation Evaluation Disenchantment Confusion Search for guilty Punishment for innocent Distinction for uninvolved PLC and New Product Introductions 3.3 Steps in the Planning Process: Plan vs. Reality
PLC and New Product Introductions 3.4 Reasons for Failure: “The Vision Thing” 1. Lack of Strategic Direction 2. Competitive Point of Difference 3. Product Did Not Deliver Promise 4. Management Commitment 5. Price/Value Relationship 3.5 New Product Introduction Postures 1. Deal With Innovation as it Occurs - Defensive: emphasis on marketing mix, e.g. flanker * Datril challenges Tylenol - Extra Strength * Ziplock challenges 2. Imitative: fashion, technology (e.g. Cusinart) 3. Second but Better: marketing clout + positioning - VisiCalc Lotus Excel - Mutimate WordPerfect Word 4. Responsive: respond to marketplace, e.g., Teflon 5. Proactive: Allocate Resources to Control
Category Pioneer Dominant Position Video Recorders Facsimile PC’s Wine Coolers Disposable Diapers Copy Machines Video Games Ampex (1956) Xerox (1964) MITS (1975) California Cooler (1981) Chux (1950) 3M Thermofax (1950) Magnovox Odyssey (1973) RCA (1977) Sharp (1982) IBM (1981) Seagram, Bartles & James (1984) P&G Pampers (1961) Xerox (1959) Nintendo (1985) PLC and New Product Introductions 3.6 First Mover Vs. Late Entry
PLC and New Product Introductions > First Mover Advantages 1. Consumer-Based Advantages - Knowledge that product works - Communicate information on attributes - Position near center of the market 2. Producer-Based Advantages - Barriers to entry: cost + technological > First Mover Disadvantages 1. Free Rider Effects 2. Technology and Market Uncertain 3. Shifts in Customer Needs 4. Incumbent inertia
Mopral Ogast Zoltum Lanzor PLC and New Product Introductions Ulcer-Proton Pump Inhibitors 1 0.9 0.8 0.7 0.6 0.5 0.4 0.3 0.2 0.1 0 Market Share 25 26 27 28 29 30 31 32 33 34 35 36 37 38 Quarters
1 0.9 0.8 0.7 0.6 0.5 0.4 0.3 0.2 0.1 0 Lopril Renitec Captolane 1 3 5 7 9 11 13 15 17 19 21 23 25 27 29 31 33 35 37 2 4 6 8 10 12 14 16 18 20 22 24 26 28 30 32 34 36 38 PLC and New Product Introductions Hyptertension-Ace Inhibitors Market Chare Quarters
PLC and New Product Introductions > Key Factors in Success/Failure 1. Order of Entry 2. Year Entered (Lead/Lag) 3. Advertising/Promotions 4. Brand Equity 5. Positioning
PLC and New Product Introductions 3.7 The New-Product Introduction Evaluation Process Market Definition Idea Generation and Screening Go No Go Concept Evaluation Go Go No Go Pre-Test-Market Evaluation Go No Go Test Market Evaluation Go National Rollout
PLC and New Product Introductions 4. Forecasting New Product Demand (First Year Share/Volume) 4.1Trial Repeat Model Share% = Available% x Aware% x Trial% x Repeat% Historically: Test Markets Problem: Cost Timing 1970's Simulated (or Pre) Test markets Advantage: Relatively cheap Fast 4.2 Steps in Trial-Repeat Modeling 1. Measure Trial - laboratory - purchase intention 2. Calculate Penetration (P): Awareness x Availability x Trial 3. Measure Repeat (R1) & Switchback (SB) - call back 4. Compute Repeat Rate (Retention): R = SB/(1 + SB - R1) 5. Compute market Share: MS = P x R
PLC and New Product Introductions 4.2.1Conceptual Framework At any given time, t, purchases of a brand can be divided into two groups: those who purchased the brand last time and those who didn't. Now consider t + 1 The consumers who repeat plus those who don't repeat must equal 100% of those who bought the brand at their last purchase occasion. Similarly, switchback plus non-switchback must equal 100% of those who bought the brand some time in the past, but not on the last purchase occasion. SB Bought our brand last time (X) Bought some other brand last time R1 X - R1
PLC and New Product Introductions Example 100 Consumers Tried: R1 = .81, SB = .20 Purchase Eligible Repeat Do Not Eligible SB Do Not Cycle to Repeat (R1) Repeat to SB SB 1st 100.0 81.0 19.0 - - - 2nd 81.0 65.6 15.4 19.0 3.8 15.2 3rd 69.4 56.2 13.2 30.6 6.1 24.5 4th 62.3 50.5 11.8 37.7 7.5 30.2 5th 58.0 47.0 11.0 42.0 8.4 33.6 6th 55.4 44.9 10.5 44.6 8.9 35.7 7th 53.8 43.6 10.2 46.2 9.2 37.0 = + = + (19 x .20) = (81 x .81) = Now compute the % of triers who have purchased the brand in any past period that will purchase it in the present period. Purchase Cycle Buy (R1 + SB) Buy other brands 1st 81.0 19.0 2nd 69.4 30.6 3rd 62.3 37.7 4th 58.0 42.0 5th 55.4 44.6 6th 53.8 36.2 7th 52.8 47.2 R = SB/(1 + SB - R1) = 0.513
Mentadent At $4.62 48.0% Mentadent At $5.09 42.0% = 182/520 = 202/480 Purchase Simulated Shop(T) Marketing Estimates Distribution Awareness Cumulative Trial-Penetration % Buyers Repeat Purchasing At Callback Estimate of Repeat Purchase Among Non-Repurchasing Buyers Repeat rate (SB/(1 + SB-R1) Purchase Share Estimate 95% 64% (P) (R1) (SB) (R) (P x R) 29.2% 42.0% 35.0% 37.6% 11.0% 25.5% 32.0% 34.0% 33.3% 8.5% PLC and New Product Introductions 4.2.2 Case Study: Mentadent 1000 consumers Simulated shopping: 480 purchased 520 no purchase Call Back Yes No LAB Yes 202 278 480 No 182 338 520 384 616 1000
COMPARISON OF PRE-TEST-MARKET AND TEST-MARKET SHARES 30 28 26 24 22 20 18 16 14 12 10 8 6 4 2 0 • • • COMPARISON OF PRE-TEST-MARKET, ADJUSTED, AND TEST-MARKET SHARES • • TEST MARKET SHARE • Overall HBA Household Food • (n = 44) (n = 13) (n = 11) (n = 20) • • • • • • Average test market share 7.16 7.35 10.14 5.40 Pre-test versus test-market share Mean difference 0.61 0.43 0.61 0.73 Mean absolute difference 1.54 1.66 1.37 1.56 Standard deviation of differences 1.99 2.08 1.71 2.06 Adjusted versus test -market share Mean difference -0.01 -0.29 -0.15 0.25 Mean absolute difference 0.83 0.88 1.04 0.68 Standard deviation of differences 1.12 1.09 1.23 1.02 • • • • • • • • • • • • • • • • • • • • • • • • • • • • • • 2 4 6 8 10 12 14 16 18 20 22 24 26 28 30 PRE-TEST MARKET SHARE PLC and New Product Introductions 4.3 So How Well Do They Perform?* * Source; Urban and Katz (1983), "Pre-Test-Market Models: Validation and Managerial Implications," Journal of Marketing Research, (August), pp. 221-34.
PLC and New Product Introductions 5. Practice Problems 5.1 Assume that you are evaluating the results of a product test for a new product your firm is considering bringing to market. A product test with a in-home use test was conducted. A sample of 400 category users participated in the study. In the first phase of the study respondents were shown the product along with advertising and asked whether they would buy. The following purchase intent (PI) results were reported: definitely will not buy 25 probably will not buy 100 not sure 50 probably will buy 75 definitely will buy 150 The research report also provided information on the in-home use test as well. Of the 150 who indicated that they would definitely buy 100 indicated that they would buy again. And of those who did not have a top-box PI score (i.e., “definitely will buy”), 75 indicated that they would definitely buy after in-home use. This is a highly competitive market. The financials suggest that to meet internal standards this product must secure a long-run share of 8.5%. Your company has a presence in almost all retail channels so distribution is not a problem. The consulting firm is recommending a GO. What is your reaction to these results?
PLC and New Product Introductions 5.2 The ABB group manufactured and marketed brand "X" of laundry detergent. The market consisted of three brands "X", "Y", and "Z". The two main attributes of laundry detergent are gentleness and effectiveness. Consumer reports tested the three brands. The results are provided below (7 = best rating, 1 = worst rating). ABB had developed a new brand "valorus (V)", which claimed to be as gentle as X but more effective than X. Valorus had passed through both concept testing and product testing; therefore the ABB group commissioned a simulated test market. ABB planned to back the product launch with a 20 million dollar budget. This marketing budget will (should) achieve a 70% awareness among consumers and will be distributed through 80% of the channels. Management required a 10% share of the market to introduce Valorus. Results are provided on the next page.
PLC and New Product Introductions II. Call Back Survey All respondents left the simulated shopping experiment with a sample of Valorus. A call back interview was also scheduled. When asked whether they would like to buy more Valorus, 150 out of the original 600 who purchased Valorus in the simulated shopping experiment indicated that they would buy it again. And 80 of those who had not originally purchased Valorus indicated that they would now like to buy it. I. Simulated Shopping Trip Of the 1000 consumers, 900 purchased a brand. The purchases of the 900 people are recorded below. X 120 Y 84 Z 96 V 600 900 Should Volorus be rolled out?