Download
1 / 45
450 likes | 571 Views
1st Capacity Building Workshop on Transferring EU Legislation on Climate Change & Developing Low Carbon Policies May 24th, 2013 - Graz, Austria. Developing low carbon policies in the energy sector: timelines, drivers, constraints Dimitris Lalas. Global emission rates – impervious to crises.

E N D
1st Capacity Building Workshop on Transferring EU Legislation on Climate Change & Developing Low Carbon PoliciesMay 24th, 2013 - Graz, Austria Developing low carbon policies in the energy sector: timelines, drivers, constraints Dimitris Lalas
Global emission rates – impervious to crises 1990-99 ca 1.0%/yr 2000-12 ca 3.1%/yr Le Quere et al. , 2012
The result: Atmospheric concentrations in 1750 – 278ppm, 40% increase CDIAC data
Who contributes: Large emitter Countries Global Carbon Project, 2012
Who contributes: Developed and Developing Peters et al. , 2012
Who is responsible: Various approaches Global Carbon Project, 2012
Future projections: RCPScenarios Δ. Π. Λάλαςe-mail: lalas@facets.gr 4,1-6,1oC 1,3-1,9οC Peters et al. 2012
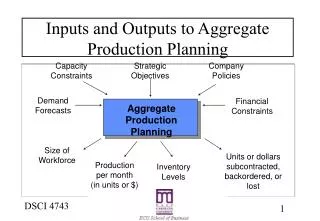
World reduction effort required Share of electricity as % of final energy demand Gross energy consumption (in Mtoe)
Changes in temperature distributions Hansen, 2012
Current EU Policy Framework - 2020 EU GHG emissions reduction target of 20% relative to 1990 (with specific targets for each MS for non-ETS emissions for a total 10% reduction relative to 2005 – Effort Sharing Directive) A 20% target of RES in the energy consumed (specific targets per MS – Directive 2009/28/EC) and a 10% target for energy for transport (for all MS) to be provided by RES plus a 6% decarbonization target of transport fuels. A 20% savings in energy consumed compared to projections (done in 2007) to be assisted by Energy Efficiency Directive (2012/27/EC) and the Ecodesign, the Energy Labeling & the Energy Performance of Buildings Directives. • Also supported by: • Strategic Energy Technology plan (SET-plan) • Energy 2020 Strategy • Proposed revision of energy products and electricity taxation
National RES & Energy Conservation Targets Directive 2009/28/EC (% on gross final energy consumption) Directive 2006/32/EC 9% reduction by 2016 Directive 2009/28/EC 20% reduction by 2020 (not to exceed 1074Mtoe of final energy) NREAPs and NEEAPs
Greek NREAP: Input Data • Macroeconomic data for the national economy • International fuel prices • Emission allowance prices • Technical-economical data of various technologies (costs, efficiency, life-cycle) • Future commissioning and decommissioning of power plants
NREAP: Scenarios Definitions 1. Reference Scenario The useful energy demand arises from the macro-economic data of paragraph 1.1. The international fuel prices are presented in paragraph 1.2. The commissioning and decommissioning of power plants in the interconnected system are presented in paragraph 1.4. No additional measures referring to RES and Energy Saving promotion are considered. • 2. Compliance Scenario • The useful energy demand arises from the macro-economic data of paragraph 1.1. • The international fuel prices are presented in paragraph 1.2. • The commissioning and decommissioning of power plants in the interconnected system are presented in paragraph 1.4. • Biomass co-combustion (by 5% mass) in the Florina 1 power plant • Implementation of the measures foreseen in the National Energy Efficiency Action Plan and achievement of the respective energy saving • Implementation of the measures for meeting the RES targets • 3. Accelerated economic recovery scenario • Similarly to the Compliance Scenario but with higher growth rates after 2014
Model Description: MARKAL, WASP, COST, ENPEP TIMES-MARKAL (MARKet Allocation) Model of ΙΕΑ It is an optimization model for the development of an energy system under the commitment of achieving the different energy and environmental targets set and considering the cost minimization. Other Models Utilized ENPEP Balance model matching demand with supply WASP Energy mix model to specify types & size of power plants to meet demand (IAEA) COST Simulates the daily operation of system calculating discarded RES (CRES) • Optimization model of the energy system • Demand driven model: the defined is defined externally and refers to input data • Includes many technologies • Simulates both available energy and energy consumption • Is used for medium/long-termed analyses
Greek NREAP: Technologies investment costs – compliance scen.
NEEAP: Measures adopted by MSs’ - Effectiveness Energy Efficiency Watch 2013
NEEAP: Measures adopted by MSs - Effectiveness Energy Efficiency Watch 2013
Road Maps 2050 EU A Roadmap for moving to a competitive low carbon economy in 2050 (http://eurlex.europa.eu/LexUriServ/LexUriServ.do?uri=) Reduce EUGHGemissions by20% by 2020and 80-95% by2050 (on 1990 revels). Approx. € 270 billionp.a.over 40 years (1.5%of EU GDP p.a. above2009 investmentlevels) Savings between € 175–320 billion p.a. (not incl. not including savings on social costs). Political and social changedrivers not covered in detail Notes importance of policyinnovation, public educationand behaviour change. Energy Roadmap 2050 Roadmap to a Resource Efficient Europe Roadmap to a single European Transport Area – Towards a competitve and resource efficient transport system
Roadmaps 2050 - countries UK: Carbon Plan http://www.decc.gov.uk/en/content/cms/tackling/carbon_plan/carbon_plan.aspx Reduce UK GHG emissions by 34% by 2020 and 80% by 2050 (on 1990 levels) Total net present cost over lifetime of policies in past carbon budget periods approx £ 9billion. Average cost 0.4% of UK GDP p.a. in period 2008–22 and 0.6% of UK GDP per year over 2023–27 Importance of UK Government, industry and citizens ‘pulling in the same direction in order to achieve low carbon transition. Australia: Clean Energy Future http://www.cleanenergyfuture.gov.au/clean-energy-future/ourplan/ Reduce Australian GHG emissions by 5% by 2020 and 80% by 2050 (on 2000 levels) Carbon price and related measures to raise approx. AUD$ 25.5 billion in the period 2011–15. Further $3.9 billion public funds to augment Carbon price as central driver of change. Strong emphasis on limited impact of policy measures on Australian economy and lifestyles
Roadmaps 2050 - countries Denmark:Our FutureEnergy http://ens.netboghandel.dk/publikationer/publikationsdetaljeraspx?PId=5308989e-ea64-436b-8346-4e29c8a84d62 100%renewableenergy in allDanish energysupply by2050 Cost to 2020 approx.DKK 5.6 billion (US$952million). Immediate netcosts of < 0.25% GDP in2020. Averageadditionalcosts to Danishhouseholds approx. DKK1,700 (US$ 289) in 2020 Assumes strong ongoing rolefor government in encouraging innovation andcommunity education. State of California:ScopingPlan & Clean EnergyFuture Plan http://www.arb.ca.gov/cc/scopingplan/document/scopingplandocument.htm http://www.cacleanenergyfuture.org/ Reduce GHGemissions to1990 levels by2020 and 80%of 1990 levelsby2050; 33%of electricityfromrenewableenergy by2020 Ongoing costs approx.US$36 million p.a. Benefits by 2020(compared to BAU)include increases ineconomic production ofUS$33 billion andoverall gross stateproduct of US$7 billion Active public participationessential. Emphasis on role for marketforces and growingenvironmental awareness toshift individual choices andattitudes. Targeted public outreach,marketing and educationprograms.
Roadmaps 2050 - countries Germany: EnergyConcept http://www.bmu.de/files/english/pdf/application/pdf/energiekonzept_bundesregierung_en.pdf ReduceGerman GHGemissions by40% by 2020and at least80% by 2050(on 1990levels) Additional investment€20 billion p.a., offset byenergy cost savings Importance of publicunderstanding and supportfor transition. Emphasisesimportance of accessibleinformation, transparentdecision making andopportunities for publicdialogue. Greece: Roadmap 2050 http://www.bmu.de/files/english/pdf/application/pdf/energiekonzept_bundesregierung_en.pdf ReduceGerman GHGemissions by40% by 2020and at least80% by 2050(on 1990levels) Additional investment€20 billion p.a., offset byenergy cost savings Importance of publicunderstanding and supportfor transition. Emphasisesimportance of accessibleinformation, transparentdecision making andopportunities for publicdialogue.
“Developing” Countries Plans – 2020 horizon India:National Action Plan& Low CarbonGrowth Report http://pmindia.nic.in/Pg01-52.pdf http://planningcommission.nic.in/reports/genrep/Inter_Exp.pdf Reduce India’semissionsintensity ofGDP by 20–25% by 2020(on 2005levels) People’s Republic ofChina: 12th Five-YearPlan & ClimateChange White Paper http://cbi.typepad.com/china_direct/2011/05/chinas-twelfth-fivenew-plan-the-fullenglish-version.html http://www.gov.cn/english/official/2011-11/22/content_2000272.htm ReduceChinese CO2emissions perunit of GDP by40–45% by2020 (on 2005levels) Total investment (publicand private) in ‘newenergy’ of approx RMB5trillion (US$760 billion) over next 10 years SouthKorea: Green GrowthStrategy http://www.greengrowth.go.kr/english/en-main/index.do/ Reduce KoreanGHGemissions by30% belowprojected 2020levels(equivalent to4% reductionon 2005levels) Total investmentannounced as part ofFive-Year Plan (2009–13) US$83.6 billion
EU Energy Roadmap 2050: Current Policy Scenarios • Reference scenario. The Reference scenario includes current trends and long-termprojections on economic development (gross domestic product (GDP) growth 1.7% pa).The scenario includes policies adopted by March 2010, including the 2020 targets for RESshare and GHG reductions as well as the Emissions Trading Scheme (ETS) Directive. Forthe analysis, several sensitivities with lower and higher GDP growth rates and lower andhigher energy import prices were analysed. • Current Policy Initiatives (CPI). This scenario updates measures adopted, e.g. after theFukushima events following the natural disasters in Japan, and being proposed as in theEnergy 2020 strategy; the scenario also includes proposed actions concerning the "EnergyEfficiency Plan" and the new "Energy Taxation Directive".
EU Energy Roadmap 2050 : Decarbonization Scenarios High Energy Efficiency. Political commitment to very high energy savings; it includese.g. more stringent minimum requirements for appliances and new buildings; Highrenovation rates of existing buildings; establishment of energy savings obligations onenergy utilities. This leads to a decrease in energy demand of 41% by 2050 as comparedto the peaks in 2005-2006. Diversified supply technologies. No technology is preferred; all energy sources cancompete on a market basis with no specific support measures. Decarbonisation is drivenby carbon pricing assuming public acceptance of both nuclear and Carbon Capture &Storage (CCS). HighRenewable energy sources (RES). Strong support measures for RES leading to avery high share of RES in gross final energy consumption (75% in 2050) and a share ofRES in electricity consumption reaching 97%. Delayed CCS. Similar to Diversified supply technologies scenario but assuming that CCSis delayed, leading to higher shares for nuclear energy with decarbonisation driven bycarbon prices rather than technology push. Low nuclear. Similar to Diversified supply technologies scenario but assuming that nonew nuclear (besides reactors currently under construction) is being built resulting in ahigher penetration of CCS (around 32% in power generation).
Energy savings potential EU EU Energy Efficiency Ecofys 2013
EC Communication March 2011:A Cost-efficient Road Map towards 2050 • 80% reduction is possible with internal actions • with existing technology, • with changes in energy use thru price policies • all sectors have to contribute Cost efficient trajectory: -25% in 2020 -40% in 2030 -60% in 2040 32
Nordics Roadmap 2050 -70% -85% +15% Nordic Energy Research Report: Pathways to a carbon neutral energy future, 2013
Nordics Roadmap 2050 Nordic Energy Research Report: Pathways to a carbon neutral energy future, 2013
Nordics Roadmap 2050 Nordic electricity generation needs to be fully decarbonised by 2050. Wind generation,today some 3% of Nordic electricity generation, needs to grow particularly quickly andalone to account for some 25% of electricity generation in 2050. This will increase the needfor flexible generation capacity, grid interconnections, demand response and electricity storage. Total investments required in the power sector are equal to some 0.7% of cumulative GDPover the period.
Nordics Roadmap 2050 To achieve the necessary 60% reduction in direct industry emissions (from 2010levels), all sectors must contribute bytaking up energy efficiency measures andCCS technologies. At present, Nordic industry is characterised by a high share of energyintensive Industries. All countries except Denmark use more energy per unit of GDP than theOECD average. Collectively, industry will need to cut the share of fossil fuel in its energy usein half, i.e. to below 20%. Even combined with very aggressive action to increase energy efficiency, this is not enough to reduce emissons to the extent necessary. Consequently, 50% of cementplants, and at least 30% of iron and steel and chemical industries, need to be equipped withCCS in 2050. To make this scenario possible, current uncertainty over national positions onCCS must be resolved.
Nordics Roadmap 2050 Transport requires the most dramatic emissions slash, from 80 million tonnesof carbon dioxide (MtCO2) in 2010 to just 10 MtCO2 in 2050. This will requirelimiting growth in transport demand, substantial reductions in technology costs, securing asustainable biofuel supply and intelligent modal shifts. Improved fuel economy provides themajority of transport emissions reduction through 2030, with biofuels and electric vehiclesbecoming more important in the longer term. By 2050, average fuel consumption of newcars must decrease to about 3 litres per 100 kilometres (L/100km), down from 7L/100kmin 2010. Electric vehicles including plug-in hybrid, battery and fuel-cell electric vehicles mustreach 30% of total sales in 2030 and 90% in 2050. Long-haul roadfreight, aviation andshipping remain dependent on high-energy-density liquid fuels even in 2050, resulting in anincreased demand for biofuels.
Nordics Roadmap 2050 Direct CO2 emissions in the building sector are relatively low, but emissionsassociated with the energy used in buildings must be reduced from 50 MtCO2 in2010 to approximately 5 MtCO2 in 2050. In addition to decarbonising electricity supply,several reduction options exist in the buildings sector itself. Widespread retrofits of olderbuilding stock will be needed to achieve the necessary energy efficiency improvements. In theshort term, policies should focus on improving existing building shell performance and onrequiring best available technologies (BATs) for space heating. In the longer term, moreadvanced building technologies, urban planning, and intelligent systems that empowerconsumers and encourage behaviour change become the higher priority.
Greek Roadmap to 2050 • A current policies (CP) scenario assuming conservative implementation of energy and environmental policies with a moderate reduction of GHG emissions and penetration of Renewable Energy and Energy Efficiency technologies. • A RES Maximization (RESM) scenario with electricity generation at almost 100 % to achieve GHG reduction of GHG by 60% and 70% in 2050 from 2005 levels. • An Environmental Measures and Cost Minimization scenario (EMCM), defining the least cost solution for reducing GHG emissions by 60% and 70% through large-scale Renewables penetration.
Greek Roadmap to 2050 (L. Moldechai, 2009)
EU Roadmap: On the way to 2050 Range of fuel shares in primary energy consumption as % wrt 2005 (yellow diamonds)
Problems in the Horizon: Eurelectric warning 2013 • Power Choices Reloaded Scenario • Like EC All Options scenario • Meets all 2020 targets, ener effic in 2025 • ETS carbon prices and after 2020 uniform price to all • Measures to overcome non-economic barriers • Key grid and infrastructure as planned Reference scenario cost 14.5% projected GDP Eurelectric Report May2013
Thank you for your attention Dimitri Lalas lalas@facets.gr