Download
1 / 12
120 likes | 333 Views
Ohio Academy of Sciences Presentation, 14 April 2012: SATELLITE MULTISPECTRAL COMPOSITIONAL MAPPING OF LAKE CYANOBACTERIAL BLOOMS (US PATENT NO. 7,132,254) AND LAND CHEMICAL COMPOUNDS. Dr. Robert K. Vincent Dept. of Geology Bowling Green State University rvincen@bgsu.edu.

E N D
Ohio Academy of Sciences Presentation, 14 April 2012:SATELLITE MULTISPECTRAL COMPOSITIONAL MAPPING OF LAKE CYANOBACTERIAL BLOOMS (US PATENT NO. 7,132,254) AND LAND CHEMICAL COMPOUNDS Dr. Robert K. Vincent Dept. of Geology Bowling Green State University rvincen@bgsu.edu
What Does LANDSAT TM Data Offer for Mapping Cyanobacterial Blooms in Lakes and Streams? • Besides the lone thermal infrared band, LANDSAT TM has 6 reflected sunlight spectral bands in the 0.4-2.5 µm wavelength region with 30-m spatial resolution (each pixel covers about 1/5th of an acre), yielding these advantages over human observations from boats or docks: • TM data can make observations as dense as 5 observations (or measurements if a tested algorithm exists) per acre over an entire body of water for most lakes (3 frames required for all of Lake Erie). • TM data can observe what humans cannot see, because 3 of its 6 spectral bands are outside the visible light wavelength range. • TM looks ±3° from straight down (nadir), reducing surface (specular or glint) reflection in calm water. • TM data can be downloaded to the company’s computer within 24 hours of overpass (every 16 days for one LANDSAT and every 8 days for 2 LANDSATs), and the entire lake can be processed in a few hours. • Blue Water Satellite, Inc. has licensed 7 (one more being added) algorithms for which BGSU has applied for patents thus far.
Phycocyanin and Microcystin Content Algorithms for Which BGSU Has Applied for Patents • LBPC (Low Bloom Phycocyanin Content) • Maps low blooms of cyanobacteria in water in the 2-17 µm/L (ppb) range, with rms error = 3.1 ppb • Can map cyanobacteria blooms before they can be identified by a human observer in a boat on the water (helps early mitigation) • HBPC (High Bloom Phycocyanin Content • Maps high blooms of cyanobacteria in water in the 2-64 µm/L (ppb) range, with SE= 7.2 ppb • MC (Microcystin Content) • Maps toxin Microcystin in high blooms of cyanobacteria in water in 2-63 µm/L (ppb) range, and it has been correct on 45of 47 water samples from 2 dates of collection, as to whether MC was above or below the World Health Organization sporting lake advisory limit of 20 µm/L (ppb)
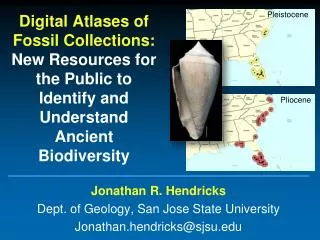
Maumee Bay, Lake Erie, Sept. 25, 2008; Natural Color (Left), Microcystin Alg. (Right; Higher Levels Red)
Color Scale for Microcystin Content • Red 90-150 µg/L • Orange 80- 89 µg/L • Yellow 60- 79 µg/L • Blue-Gr. 45- 59 µg/L • Blue 1 - 44µg/L (in water) • D. Blue 0 (neg. numbers on land)
Microcystin Image with MC>20 µg/L in Colors Other Than Dark Blue, Where the WHO Sporting Lake Advisory Should be Given
Phosphorous Content Algorithms for Which BGSU Has Applied for Patents • LRTP (Low-Range Total Phosphate in Water) • Maps the amount of total phosphate in water in range 9-100 µg/L (ppb); accuracy ±5 ppb from 9-33 ppb • HRTP (High-Range Total Phosphate in Water) • Maps the amount of total phosphate in water in the range 100-700 µg/L (ppb); rms error = 69 ppb • TPL (Total Phosphate on Land) • Maps the amount of total phosphorous on/in bare soil in range 550-2500 mg/kg (ppm) with SE=531 ppm
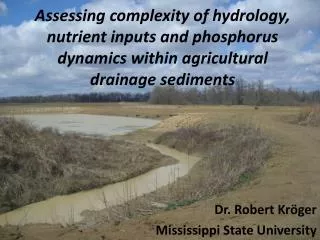
Fig. 5. Image showing the total P concentration (mg/kg) in surface soil samples of F34 (left side of the image) and F11 (right side of the image) fields displayed as red (high P content) to Turquoise (low P content) obtained by applying the P spectral ratio model to the LANDSAT 5 frame of May 20, 2005 which was used for developing the model. Field near Oregon, OH; field on left had Class B sewage sludge injected hours earlier.
Conclusions • Tested algorithms pertaining to cyanobacterial blooms currently exist that employ LANDSAT TM data for mapping: • Pigment content in surface waters (phycocyanin) • Toxin content in surface waters (Microcystin) • Nutrient content in surface waters (T. Phosphate) • Nutrient content on bare soil (T. Phosphate) • Others (Total Sulfate content in surface waters; Copper and Sulfur contents in bare soils) • It is time to use satellite monitoring for cyanobacterial blooms in lakes and streams.