Download
1 / 35
350 likes | 484 Views
The Australian Secondary Principals’ Association (ASPA) MYSchool Survey March 2010 Results. Nature of Respondents. 43% of Australian government secondary schools responded 72% of respondents were principals, 19% Deputy Principal’s or Assistant Principal’s and a further

E N D
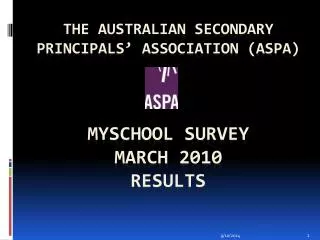
The Australian Secondary Principals’ Association (ASPA)MYSchool SurveyMarch 2010 Results
Nature of Respondents • 43% of Australian government secondary schools responded • 72% of respondents were principals, • 19% Deputy Principal’s or Assistant Principal’s and a further • 5% other school personnel ASPA MySchool Survey March 2010 Results
Question 10: • What effect has publishing a comparison of NAPLAN results had on:
Students, Community, Staff. • 56% report that the publication of the comparative NAPLAN results had major negative effects on their staff • 35% reported a negative effect on community’s confidence in their school and 24% on their students.
Question 12: • Now that comparative school NAPLAN results have been published, what will be the likely, or actual, effect on:
Comments • “Staff spend more time teaching to the test and less on higher-level thinking skills. The curriculum is narrowed and a school's worth is limited to the average of these 1 hour test scores.”[Qn13:18]
Comments • “I have taken periods out of the curriculum in years 7 and 9 to teach to the test. “
Comments • “We struggle to keep students at the school, despite the outstanding programs our staff run.” • “Student numbers will drop reducing curriculum breadth and denying student choice. There will be fewer more able students reducing role-models for less able students.”
Comments • “As Principal you "own" the results so unless they are outstanding anyone can point the finger. “ • “Personally it has presented me with the greatest challenge of my professional career in supporting the staff and students of this great community. “
Question 14: • Indicate the changes to your school's curriculum that have actually occurred as a result of the publication of school NAPLAN results
Major finding - extensive changes principals are making • in order to accommodate the tests and • in seeking to improve the performance of their students. • Increasing time spent on • literacy and numeracy (51%) • NAPLAN test preparation (65%) • Presently within subject offerings
Question 15: • Please indicate how your use of the strategies below (if applicable) has changed in order to improve student/school NAPLAN results?
Common strategies to improve student/school NAPLAN results • Trial/practice NAPLAN tests (increased in 70% of schools) • emphasising professional development (increased in 60% of schools)
Comments • Some “will be monitoring the impact of targeting NAPLAN preparation on student literacy and numeracy outcomes as opposed to literacy and numeracy programs in their own right”[Qn16:35]
Comments • Many believe • “training students to pass a test has detracted from curriculum time.[Qn16:50] • and have • “modified worksheets to incorporate multiple choice questions/answers. Three-level guides are far more effective for reading comprehension, but they're not tested in NAPLAN.”[Qn16:50]
Question17. • What actions would you support to prevent the misuse of the publishing of a comparison of school NAPLAN results?
Actions to prevent misuse • All options for preventing misuse of the published data received strong support • Greatest support (approx 80%) • addition of longitudinal data and • exempting special education units
Some say that they “….do not believe that it is possible to prevent the media misusing the data. There will need to be continual publicity from the government and each school as to what the data means, how it is collected, what it does do, and what it doesn't do.”[Qn18:1].
Summary • Great deal of concern about the publication of results - being compared with schools that seem to be most unlike them. • “We have a like school .. [whose] families come from the best educated, most affluent in our town while we work with the most disenfranchised. Guess how different our NAPLAN results are?”
Summary • Schools expressing most concern are those with middle ICSEA rankings • Nearly 50% of them being negatively or strongly negatively affected • band 899-800 and 1099-1000 • 67% and 53% respectively report a negative or strongly negative effect on them personally
Summary (Cont’d) • Redirection of • time away from other areas of the curriculum with the potential loss of curriculum diversity, and • resources towards students with potentially poor NAPLAN test results • The negative effect on principals personally and their concern for their staff – they wish to be supportive of their staff.
Finis • John K See Consulting • M 0417 202 275 • E johnksee@gmail.com