Download
1 / 18
180 likes | 294 Views
A stepwise approximation for estimations of multilevel hydraulic tests in heterogeneous aquifers. PRESENTER: YI-RU HUANG ADVISOR: CHUEN-FA NI DATE: 2011-3-10. Outline. Introduction. Motivation. Objective. Methodology. Results & Discussion. Conclusions. Future work. Introduction.

E N D
A stepwise approximation for estimations of multilevel hydraulic tests in heterogeneous aquifers PRESENTER: YI-RU HUANG ADVISOR: CHUEN-FA NI DATE: 2011-3-10
Outline • Introduction • Motivation • Objective • Methodology • Results & Discussion • Conclusions • Future work
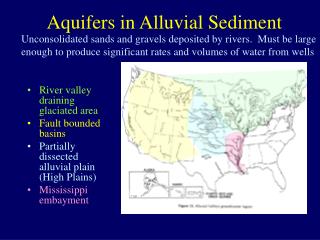
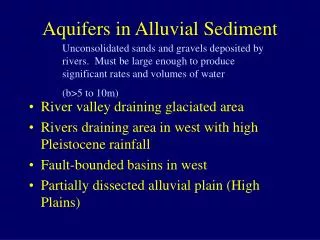
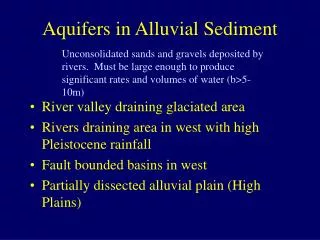
Introduction • Ground water investigations have relied on the determination of aquifer parameters. • Knowledge of detailed spatial distributions of hydraulic properties is important to improve our ability to predict water and solute movement in the subsurface. Detailed spatial distributions of hydraulic properties. Hydraulic tomography is a viable technology to estimate the parameters in heterogeneous aquifer. [Gottlieb & Dietrich, 1995, Butler et al, 1999, Vasco et al., 2000, Yeh & Liu, 2000, Liu et al., 2002, Bohling et al., 2002, McDermott et al., 2003, Brauchler et al., 2003, Zhu & Yeh, 2005, Liu et al., 2007, Straface et al., 2007, Illman et al., 2007]
IntroductionHydraulic tomography • Datacollection: Cross-hole pumping test • To obtain manyindependent pumping test data. • Data integration:Numerical inversion • To integrate information of aquifer and estimate parameters. The K tomogram
packer packer packer packer packer packer packer packer packer packer packer packer packer packer packer packer packer packer packer packer packer packer packer packer packer packer
The limit of equipment in field test. Changing the packer position. The field pumping test data.
Objective • To conduct numerical investigations to assess how and to what degree the accuracy of the field tests for estimation.
Methodology Generation of random field A series of pumping events Many packers, obtain data simultaneously Limited packers, obtain data sequentially Numerical model Comparison of the results
Generation of random field Mean: 0.0001m/s Variance: 0.1 Correlation length: 20x5m
A series of pumping events obtain data simultaneously obtaindatasequentially Numerical model
Results & Discussion obtaindatasequentially obtain data simultaneously
Conclusions • To obtain the data in each depth by changing packer position is practicable in field test. • The field data we obtained are usability to estimate the spatial distribution of hydraulic properties.
Future work • To conduct more numerical examples and insight the application for practical problem. • the degree of heterogeneity • the observation intervals • the duration of sampling time • the extension of numerical boundaries