Download
1 / 27
270 likes | 352 Views
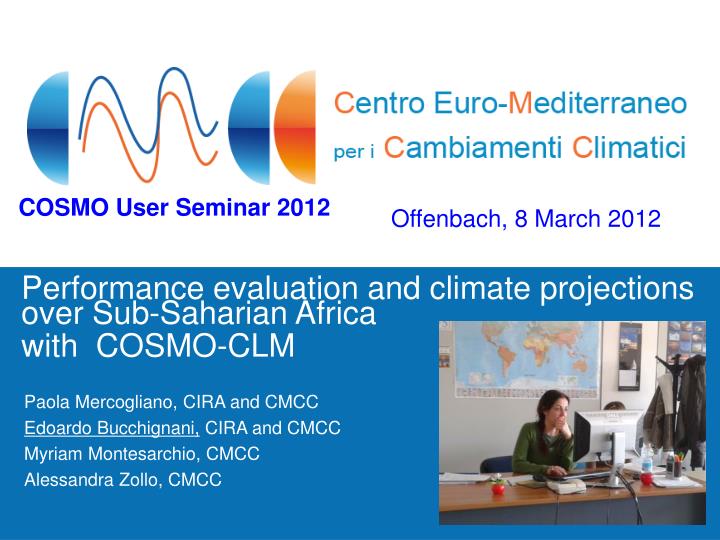
COSMO User Seminar 2012. Offenbach, 8 March 2012. Performance evaluation and climate projections over Sub-Saharian Africa with COSMO-CLM. Paola Mercogliano, CIRA and CMCC Edoardo Bucchignani, CIRA and CMCC Myriam Montesarchio, CMCC Alessandra Zollo, CMCC. 1. Outlook. Introduction

E N D
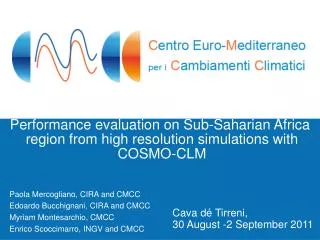
COSMO User Seminar 2012 Offenbach, 8 March 2012 Performance evaluation and climate projections over Sub-Saharian Africa with COSMO-CLM Paola Mercogliano, CIRA and CMCC Edoardo Bucchignani, CIRA and CMCC Myriam Montesarchio, CMCC Alessandra Zollo, CMCC
1. Outlook • Introduction • Short summary of activity shown at CLM Assembly 2011 • The CLUVA project • The domains simulated • List of simulations • The West domain: validation and climate projections • The Lower East domain: validation and climate proj. • Conclusions
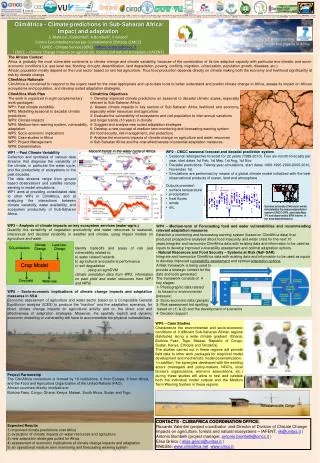
2. CLUVA – Climate change and urban vulnerability in Africa Project Co-ordinator: AMRA, Center of Competence in the field of Analysis and Monitoring of Environmental Risk, Italy The project objective is to develop methods and knowledge to be applied to African cities, to manage climate risks, to reduce vulnerabilities and to improve their coping capacity and resilience towards climate changes. The project will explore the issues of climate change vulnerability, resilience, risk management and adaptation in selected African cities with local partners. Task 1.1: Model projection of climate change (Leader: CMCC) • The aim is to set up methods and work out probabilistic scenarios of climate change affected hazards having a resolution that fits for regional and urban systems (for the 5 selected cities) and related uncertainties. More detailed aims are: • To produce downscaled regional climate scenarios (IPCC scenarios: RCP4.5 and RCP8.5) for selected African areas surrounding the African cities of interest, at high resolution (about 8 km). • To produce very high resolution projection (about 1-2 km) for the climate of some African cities using specific and accurate statistical techniques
3. Areas ofinterest for CLUVA 1950-2050 Spatial Resolution: 8 km EAST Domains: U(34.4 – 42.9 E; 6.1N – 12.5N) 120 x 90 gridpoints L (34.5 – 41.3 E; 11.8S – 2.1S) 95 x 135 gridpoints WEST Domain: (18 W -15.17 E; 3.3 – 16.8 N) 465 x 190 gridpoints St.Louis (16.5 W, 16.03 N)Ougadougou (1.55 W, 12.37 N) Douala (9.71 E, 4.045 N) Addis Abeba (38.75 E, 9.02 N) Dar es Salaam (39.27 E, 6.82 S)
4. Orography of the three areas West Upper East Lower East
5. Details of the Numerical simulations • 8 km resolution • Supercomputer used: • Cluster of 30 IBM P575 nodes (32 cores per node) • Driving data: CMCC-MED 80 km resolution • Model version: cosmo_090213_4.8_clm13 • Time step: 40 sec. • Numerical scheme: Runge-Kutta 2-time level HE-VI integration • Validation: CRU data and observed datasets for the 5 cities.
6. List of simulations • Scenario A1B West domain 1970- 2065 • Scenario RCP 4.5 Lower East domain 1950-2050 • Scenario RCP 4.5 Upper East domain 1950-2050 (*) • Scenario RCP 4.5West domain 1950-2050 • Scenario RCP 8.5Lower East domain 1950-2050 • Scenario RCP 8.5Upper East domain 1950-2050 (*) • Scenario RCP 8.5West domain 1950-2050 (*): completed, but not yet post processed.
7. Mean temperature bias with CRU (COSMO-CRU) 1971-2000 DJF Cold bias between -1 and -2 degrees. In the north part, up to -5 JJA Hot bias between 2 and 3 degrees. Higher values in the west part.
8. Mean precipitation (mm/month) bias with CRU 1971-2000 DJF Underestimation of about 25% in the south coastal area. Good agreement in the other parts. JJA A strong wet bias is registered in the south coastal area. Underestimation in other parts.
9. Seasonal cycle of temperature (COSMO vs Observations) St. Louis Max Applied Bias correction (Sperna et. Al 2010): : 30-year daily average temperature Mean Maximum bias in April (20C)
10. Seasonal cycle of temperature (COSMO vs CRU) Douala Ouagadougou Max Mean
11. T2m variation : future (2021-2050) vs past (1971-2000) A1B DJF General increase of temperature, up to 2.4o; it is more evident in winter. JJA
12. T2m variation : future (2021-2050) vs past (1971-2000) RCP4.5 DJF Less evident increase of temperature, especially in summer. In winter, significant increase in the northern part. JJA
13. T2m variation: future (2021-2050) vs past (1971-2000) RCP8.5 DJF Larger increase of temperature in summer with respect the other scenarios. In winter, the increase is evident only in the northern part. JJA
14. Precipitation variation: future (2021-2050) vs past (1971-2000) A1B DJF There is a big difference between winter and summer. In winter, there is a slight decrease of precipitation, while in summer there is a general increase with some exceptions. JJA mm/month
15. Precipitation variation: future (2021-2050) vs past (1971-2000) RCP4.5 DJF There are differences between winter and summer. In winter, there is a general increase of precipitation, while in summer there is a behavior similar to A1B JJA
16. Precipitation variation: future (2021-2050) vs past (1971-2000) RCP8.5 DJF In winter, there is a general increase of precipitation, similar to RCP4.5 In summer there is a behavior similar to A1B and RCP4.5 JJA
17. T2m trend (A1B vs RCP 4.5) Ouagadougou St.Louis
18. Precipitation trend (A1B vs RCP 4.5) Ouagadougou St.Louis
19. Mean temperature bias with CRU (COSMO-CRU) 1971-2000 In winter, there is a cold bias between -2 and -3 degrees. In some parts, up to -5 In summer , there is a hot bias between 1 and 2 degrees. DJF JJA
20. Seasonal cycle of temperature (COSMO vs CRU) Dar es Salaam Max In winter , there is a cold bias especially evident in the maximum values of daily temperature. Mean
21. T2m variation: future (2021-2050) vs past (1971-2000) RCP4.5 In winter, two different areas are visible, but both characterized by an increase of temperature. In summer, a general increase of 1.5o C is evident. DJF JJA
22. T2m variation: future (2021-2050) vs past (1971-2000) RCP8.5 With this scenario, the increase of temperature is more uniform and evident with respect to RCP4.5. DJF JJA
23. Precipitation variation: future (2021-2050) vs past (1971-2000) RCP4.5 In winter, we register reductions in the central part of the domain and increases along the coast. In summer, a general reduction is evident. DJF JJA
24. Precipitation variation: future (2021-2050) vs past (1971-2000) RCP8.5 In winter, similar behavior as RCP4.5, but less evident increase along the coast. In summer, similar behavior as RCP4.5. DJF JJA
25. Conclusions • Numerical results related to the simulation of the climate of the west and the east lower domain at high resolution have been shown. • for the west domain: cold bias in winter, and hot bias in summer with respect to CRU. Better agreement registered with observed data provided by project partners. Quite good agreement of precipitations in winter, while in summer there is a strong bias; • for the east lower domain: the temperature is underestimated in winter and overestimated in summer with respect to CRU; better agreement with observed data, especially in summer; • for the west domain:in the future, the temperature is projected to increase, especially in winter with all the three scenarios; in winter the precipitation is projected to slightly increase by RCP4.5 and 8.5; in summer is projected to increase by all the scenarios. • for the east lower domain:in the future, the temperature is projected to increase by both the scenarios, especially in winter.