Download
1 / 2
20 likes | 109 Views
Time to Primary Outcome. # at Risk. Yr 1. Yr 2. Yr 3. Yr 4. Yr 4.5. T. 8,542. 8,177. 7,778. 7,420. 7,051. 4,575. R. 8,576. 8,214. 7,832. 7,472. 7,093. 4,562. 0.25. 0.20. 0.15. Telmisartan. Cumulative Hazard Rates. Ramipril. 0.10. 0.05.

E N D
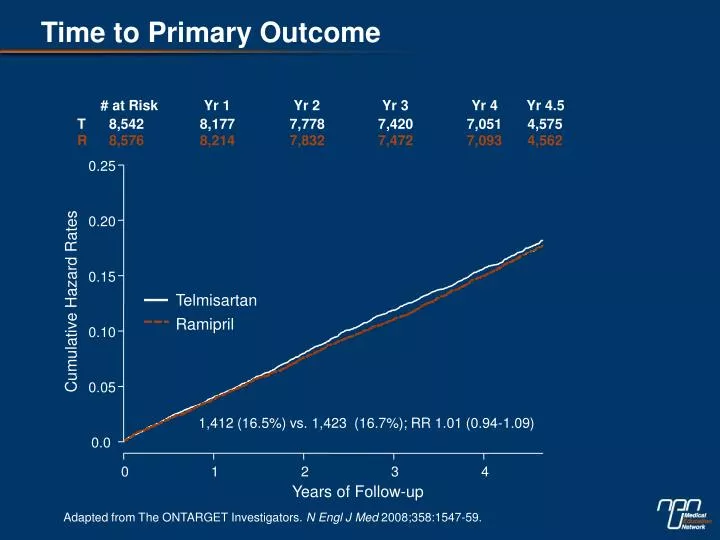
Time to Primary Outcome # at Risk Yr 1 Yr 2 Yr 3 Yr 4 Yr 4.5 T 8,542 8,177 7,778 7,420 7,051 4,575 R 8,576 8,214 7,832 7,472 7,093 4,562 0.25 0.20 0.15 Telmisartan Cumulative Hazard Rates Ramipril 0.10 0.05 1,412 (16.5%) vs. 1,423 (16.7%); RR 1.01 (0.94-1.09) 0.0 0 1 2 3 4 Years of Follow-up Adapted from The ONTARGET Investigators. N Engl J Med 2008;358:1547-59.
Adherence Rates of Antihypertensive Medication During Six to 24 Months in Saskatchewan 80 ** 6 mos * * * 12 mos 70 18 mos 60 24 mos 50 40 Percentage (%) 30 20 BB 10 0 bb DIUR ACEI CCB OTHER COMBO ARB *P=0.001 vs. each of the other classes; **P=0.030 vs. DIUR, P=0.002 vs. others Adapted from Chaput AJ. Saskatchewan Health Database