Download
1 / 33
330 likes | 334 Views
Learn about the principles of Lean and Six Sigma and how they can be applied to create a competitive advantage by becoming faster, better, and cheaper in the in-plant operations. Understand the significance of Six Sigma and its impact on process improvement. Explore the DMAIC methodology and the importance of metrics in meeting customer needs. Discover how to achieve near-perfection in system quality and reduce costs by at least 40%.

E N D
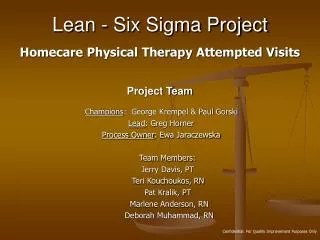
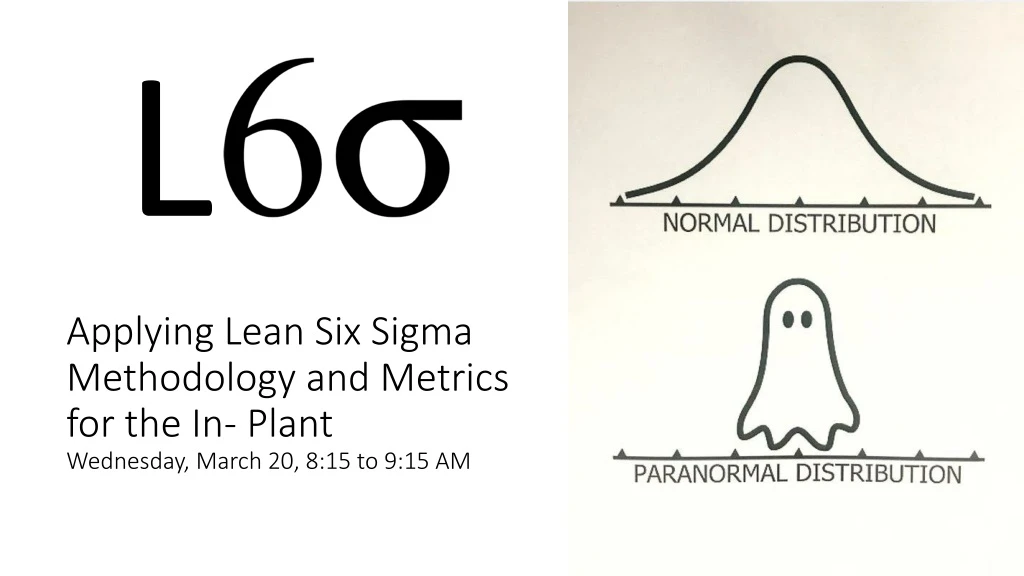
L Applying Lean Six SigmaMethodology and Metrics for the In- PlantWednesday, March 20, 8:15 to 9:15 AM
Difference Between Lean and Six SigmaLean Six Sigma Demystified, 2nd Edition LEAN/SIX SIGMA- simply is a set of methods and tools that help customers create a competitive advantage by becoming faster, better, and cheaper than their competition • LEAN- helps companies cut the time it takes to meet customer demands • SIX SIGMA- helps find and fix the mistakes, errors, and defects involved in every aspect of delivering what the customer wants • Quantifiable and data driven- improvements are proven • Seeks to eliminate defects and variation in processes/systems • Definition of quality is near perfection in systems • A typical Six Sigma Breakthrough project reduces costs by at least 40% • Customer centric- everything revolves around the customer
What Does Six Sigma Mean? why strive for six sigma? 6σ • Standard deviation is expressed by the Greek lower case letter sigma σ • The term Six Sigma means that in a normal distribution virtually all of the data (99.9996% ) will fall within the spread of six standard deviations from the mean (average) • Valued metric that exhibits level of process performance - ideal 6
Standard Deviation σ • Measures the spread from the mean • The average distance of the data from the mean • Indicator of variation in a process • Low sigma indicates data points tend to be very close to the mean = normal variation • Higher sigma indicates data is spread out over a large range of values = unwanted variation • A reduction in sigma often requires a significant change in the process itself
- 1 σ + 1 σ - 2 σ + 2 σ + 3 σ - 3 σ + 4 σ - 4 σ + 5 σ + 6 σ - 5 σ - 6 σ 99.3%
Six Sigma Methodology- DMAIC • Define problems in processes • Measure performance • Analyze causes of problems • Improve processes • Control processes so problems do not recur
LSS voices • Lean/Six Sigma views quality as defined by the customer • VOC: • Determines conformance • Key is locate the most necessary things required to satisfy the customer i.e. lead times • Metrics determine the capability of meeting the needs of the customer • Specifies targets and tolerances (limits) • i.e. CMYK ≤ 5∆E (CIEL*a*b*) • Are often fluid in the GrC industry • i.e. press check • VOP: • Our processes required to produce the VOC • Key is to only do what is absolutely necessary to satisfy the customer • Metrics determine how stable and predictable our processes are • Specifies control and warning (limits) • i.e. CMYK ≤ 5∆E (CIEL*a*b*)
VOC = VOP + Variation “Quality” is an attribute determined by the capability of the process or system to meet the need(s) of the customer despite known or unknown variables that can occur in the process.
why strive for six sigma? • If electricity worked at: • 4σ: no lights about 1 hour/week • 6σ: no lights about 2 seconds/week • For 300,000 VDP Mailing • 4σ: 3,000 mailers miss-delivered • 6σ: 1 miss-delivered • 500 surgical procedures produce: • 4σ: 3 dead people • 6σ: 0 dead people
Part 1- Invoicing System for External Customers The Campus Graphics insourcing AR process is an unstable process that has degraded the accounting integrity of Campus Graphics: The current state: · Utilizes two MIS (OS and PSP) that waste staff time due to duplicate efforts and rework · CG customers are not receiving invoices or is receiving duplicate invoices · In one year (spring 15 to spring 16), the delta between the two accounting systems is over $6,000 Current Ideal Reporting the Results Performance
Part 2- Invoicing System for Internal Customers • The Campus Graphics invoicing process is unstable and has degraded the accounting integrity of Campus Graphics and if left unchecked could jeopardize the funding of the operation: • College does not know the true cost of operation • Current system is incentivized to exploit categorical customers • Free copy limits allow some users to “cheat” the system • Campus Graphics relies on income from categorical and external customers in order to fund operation • The need to recoup over $200,000 in institutional chargebacks in order to fund operation Defining the problem Since the implementation of this project (7/1/17), the following improvements have been achieved - So far $113,000 in chargebacks have been captured that will be used to fund operational costs - Improvement efforts are on track to capture an additional $137,000 this year, 21% more than planned* - Automation in reporting has reduced staff time by 86%, a cost savings of $10,752 per year - Campus Graphics recoups costs to fund operation - The college now knows the true cost of Campus Graphics operational costs - Campus Graphics customers all receive fair and equitable treatment Integrity of invoicing process is transparent and supported by solid data Reporting the Results
Six Sigma Tool Belt • For Today- Six Sigma Metrics and Tools • Productivity Metrics- gauges improvement efforts • Yield Metrics- determines how well your process is really doing without rework and scrap • Complete Transaction Rating (CTR)- puts a dollar amount on the cost of poor quality
Productivity Metrics • Classic Productivity Metric Productivity %= Output x 100 Input • Measure of process improvement • Either increase output or reduce input to improve productivity ratio
Productivity Metrics Example Old System • A bindery staff of 3 works 8hrs per day • Bindery produces 1000, case bound books / day • BHR for one bindery position = $500/day What is the productivity in books/labor-hr? What is the productivity in books/dollar?
Productivity Metrics Old System What is the productivity in books/labor-min? (1000 bks/day) / (24hr x 60min) = 1000/1440 = .69 .69 x 100 = 69% What is the productivity in books/dollar? (1000 bks/day) / 3 empl. x $500 BHR = 1000/1500 = .67 .67 x 100 = 67%
Productivity Metrics Example New System • A bindery staff of2works 8hrs per day • Bindery produces 800, case bound books / day • BHR for one bindery position = $500/day What is the productivity in books/labor-hr? What is the productivity in books/dollar?
Productivity Metrics New System What is the productivity in books/labor-min? (800 books/day) / 16hr x 60min) = 800/960 = .83 New .83 x 100 = 83% Old 69% What is the productivity in books/dollar? (800 books/day) / 2 empl. x $500 BHR= 800/1000 = .80 New .80 x 100 = 80%Old 67%
Productivity Metrics Improvement % from Old to New System = (Pnew - Pold) Pold Improvement of productivity in books/labor-min? (.83 - .69) / .69 = .20 x 100 = 20% improvement Improvement of productivity in books /dollar? (.80 - .67) / .67 = .19 x 100 = 19% improvement Conclusion, your efforts has achieved a 20% improvement over the old system x 100 Six Sigma improvement projects seek 40% improvement or more!
measure defects Measuring Defects # of defects observed #of units A Six Sigma defect is defined as anything outside of customer specifications. DPU is a %. Defects per Unit (DPU): X 100 • EXAMPLE • Your estimating department produced 150 estimates last month, of which 15 had defects, what is the DPU of the estimate process? • DPU= (15 defects / 150 # units) x 100 = 10% • 90% of the estimates that leave your desk are defect-free
Defects per Opportunity (DPO): measure defects Measuring Defects total number of defects observed # of units x # of opportunities A Six Sigma opportunity is the total quantity of chances for a defect. DPO is a #. • EXAMPLE • Your estimating department produced 150 estimates last month, of which 15 had defects. On each estimate there are 15 opportunities for success or failure, what is the DPO of your estimating process? • DPO= (15 defects / (150 units x 15 opp. ) = .0067 • For every 100 opportunities for success or failure in the estimate, the estimating process will produce .6 or .7 defects
measure defects Measuring Defects Defects per Million Opportunities (DPMO): (DPO x 1,000,000) Six Sigma is often defined as striving for 3.4 DPMO. DPMO is a #. • EXAMPLE • Your DPO is .0067 what is your DPMO? • DPMO = .0067 x 1,000,000 = 6,700 • 6,700 defects per million opportunities in your estimating process • From table in notes- your estimate process is operating at 4 sigma
Empirical Rule Empirical Rule • Six Sigma is defined as a process having no more than • 3.4 defects per million opportunities 3.28+17.56+1.42+4.8+4.8+1.42+7.9+4.8+ 10.18+1.42+.66+.04+7.9+23.14+.14+.04
Yield Metrics In – Scrap – Rework In FTY accurately measures how well your process works in its true form- without rework or scrap. FTY is a %. First Time Yield (FTY): X 100 • EXAMPLE • You completed 230 estimates this week, 20 were returned to you to fix, and also 18 were so bad they had to be discarded. How many estimates were done right the first time? Referencing the table in the back of your note packet locate the your sigma level at this FTY. • FTY= (230 In – 18 Scrap – 20 Rework / 230 In) x 100 = 83% • 83% of the estimates were done the right way, 17% of the estimates were done wrong the first time= ~2.4 Sigma • Operating at 160,000 DPMO
Yield Metrics Rolled Throughput Yield (RTY): FTY1 xFTY2 ..... x FTYn RTY tells you how well the entire system works together, producing a final product right the first time without rework or scrap. RTY is a %. X 100 • EXAMPLE • You have seven process steps to complete a web design. For each process step you have a FTY of 98%, what is the chance of the entire web design process being done correctly the first time without scrap or rework? • RTY= FTY7 = (.98 x.98 x .98 x .98 x .98 x .98 x .98) x 100 = 87% • The chance of a web design going through the entire process correctly the first time, with no scrap or rework, is only 87%= ~2.6 Sigma • Operating at 100,000 DPMO
Price of Conformance (POC) • Tangible and non-tangible costs associated in doing the job right the first time and doing what we said we would do • Labor, materials, equipment, rent, utilities, etc. • Costs associated in producing product • Costs associated with inspection • Costs associated with preventing defects • Does not mean level of quality is free • Price rises with upgrades • i.e. digital vs. offset, foil vs. metallic inks, etc. • Whatever level of quality the customer chooses, the POC is doing it right the first time 3.28+17.56+1.42+4.8+4.8+1.42+7.9+4.8+ 10.18+1.42+.66+.04+7.9+23.14+.14+.04
Price of Non Conformance (PONC) • Tangible and non-tangible costs associated in having to do things over again because they were not done right the first time • Labor, materials, equipment, rent, utilities, etc. associated with: • Rework • Scrap • Delays • All the costs associated in fixing an order instead of taking in new orders • All the costs associated with having to get new customers to replace the ones lost due to poor quality • External PONC is when the customer catches the error • This is the true cost of quality 3.28+17.56+1.42+4.8+4.8+1.42+7.9+4.8+ 10.18+1.42+.66+.04+7.9+23.14+.14+.04
Cost of Poor Quality (COPQ) • Metric of Six Sigma that takes into account the cost of doing things wrong • Tangible- Scrap. rework, warranty, inspection, tests • Intangible- lost of customer loyalty and reputation, employee morale, etc.
Complete Transaction Rating (CTR) • Phillip Crosby’s Complete Transaction Rating (CTR) • When you put a dollar amount (transaction-oriented) to quality, the obvious costs for doing things over becomes apparent • To attain a CTR of 1.0 it is necessary to do thing right the first time • Cost for task done right the first time = POC • Cost for rework/scrap (materials and labor), loss of sales, loss of production time- all costs associated with having to do the task over = PONC POC (POC + PONC) CTR =
Price of Conformance Worksheet Figure 10- POC and PONC worksheet
Price of Non Conformance Worksheet Figure 10- POC and PONC worksheet
Complete Transaction Rating (CTR) Example POC (POC + PONC) CTR = • Cost for task done right the first time = POC = $4,500 • Cost for rework/scrap (materials and labor), loss of sales, loss of production time- all costs associated with having to do the task over = PONC= $6,500 • CTR = 4,500 • (4,500 + 6,500) = .41 = 1:.41 • For this job you are really only making .41 on the dollar due to poor quality issues- COPQ 59%
L Applying Lean Six SigmaMethodology and Metrics for the In- PlantQuestions?