Download
1 / 27
270 likes | 452 Views
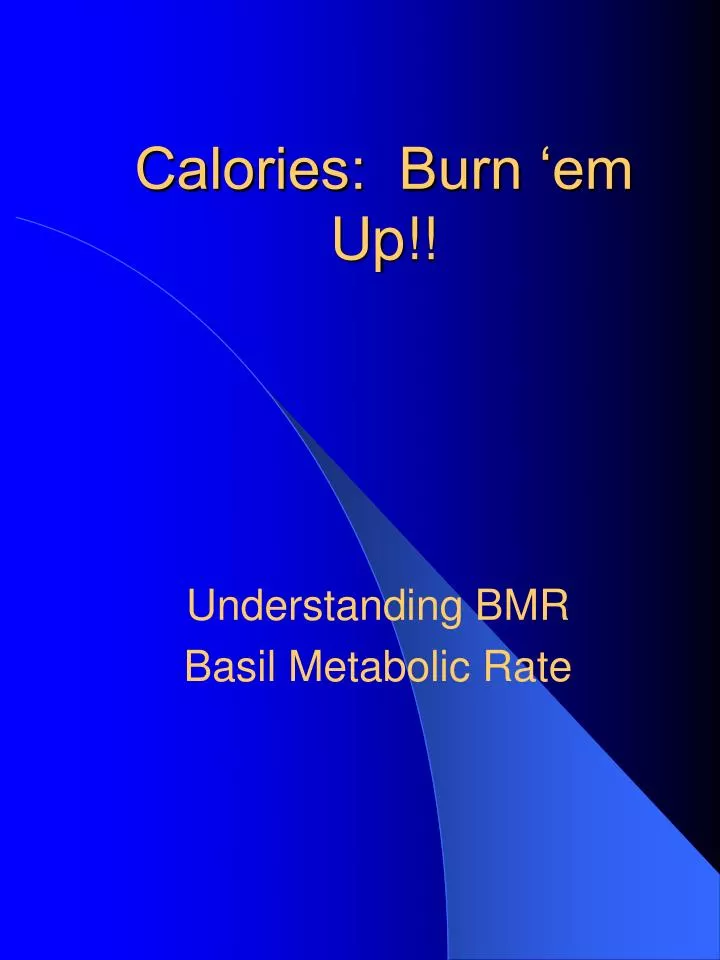
Calories: Burn ‘em Up!!. Understanding BMR Basil Metabolic Rate. On a daily basis, we need food for energy. Food is fuel. Just like an engine needs gasoline to run, we need food in order to function.

E N D
Calories: Burn ‘em Up!! Understanding BMR Basil Metabolic Rate
On a daily basis, we need food for energy. Food is fuel. Just like an engine needs gasoline to run, we need food in order to function. • Every individual needs a different amount of food to function based on their size and how efficiently they use the food. It’s very similar to every car engine getting different miles per gallon. • In people this measure is called basal metabolic rate - BMR
BMR • BMR is the rate in which food is broken down or catabolized. This measure is taken when the individual is awake and at rest or when the body is under basal conditions. That is, the body is not digesting food or adjusting to a cold environment (not working).
Another way to look at BMR is the number of calories of heat that must be produced per hour by catabolism in order to keep the body alive, awake, and comfortably warm (to keep the engine running). • This is an important factor in homeostasis – or keeping the body working properly.
Why do we care? • BMR is one of the key factors that we use in weight management programs. • So, today we will be using estimation skills (educated guesses) to interpolate (to estimate values from a graph, table or chart) the BMR of normal men and women.
Estimation • Give me an example of how you use estimation every day. • When you are about to run out of gas – how far can you go after the gauge is on “E”? • When you are in the lunch line and you want pizza, breadsticks and a small salad, how do you know if you have enough money to cover all these items? • How did you solve these problems? • Did you have to round numbers?
Rounding numbers • This is something that we traditionally do in the US. We tip people that wait on us, so let’s pretend you are the waiter. • The bill was $24.43. You’re hoping for a 10% tip. If they figure it right, your tip is… $2.44 and if they round it to the whole dollar the rule makes it $2.00– so sorry…
Rounding Rules • Find the place value to which you are rounding • $2.43 • Look at the digit one place to the right • $2.43 • If it is equal to or greater than 5, round up. • If it’s less than 5, round down. $2.00 is correct
Interpolation Interpolation is simply the process of taking estimation another step further. We look at a graph or table and there are values indicated by the lines. But some values fall between the lines and so we have to estimate that value. Let’s try some examples…
Interpolation Estimate how many physicians were employed in 1995 Why might this be difficult?
This line (called a trend line), visually fits best to make our estimation of 65, but may not be a true representation of the trend in physician growth. A better estimation might be obtained by drawing a free hand curved line.
Using a free hand curved line gives a better estimation of the true trend in physician employment. This graph now shows our estimate to be somewhere around 53. The estimates may or may not be close depending on how accurately you have drawn your line. You can see that a line graph would better allow us to interpolate data. Why is this data useful? Staffing?
If this chart shows activity level throughout an average day, how much energy did teens expend at 1 pm? Teens at 1pm = ~ 35%
Extrapolation Taking the whole process to the next level is called extrapolation. We can look at data on a graph and see the tendency of the graph in order to make predictions. Extrapolation is the ability to predict values beyond those given on a chart or graph.
Extrapolation predicts the future. How long do you think it will take Sue to walk a mile by the end of October? Sue = ~ 15 min.
Aging • As men, women, dogs, cats, birds, and probably most any other living thing you can imagine grow older, the amount of energy used by the body at rest (BMR) decreases. • You may have heard it another way – their metabolism decreases. Basically, they need less fuel to keep them going.
Normal Basal Metabolism for Men and Women 60 55 50 Males 45 Basal Metabolism (calories/m2/hr) Female 40 35 30 0 5 10 15 20 25 30 35 40 45 50 55 60 65 70 75 80 Age (in years) This graph shows normal basal metabolic rates.
Let’s Look at the Graph • What is the unit of measurement for the BMR shown in the graph? Basal metabolism = calories/square meter/hour = calories/m2/hr • How are the values for men and women distinguished in the graph? Two separate lines
Calculating BMR • What would be the normal basal metabolic rate for a 47 year-old female patient? Here’s where “interpolation” comes in…We need to “estimate” where the two lines will cross. What is the approximate value for a female, 47 years? 35 calories/m2/hr
A lab result indicated that a 12 year-old male patient has a rate of 70 calories/m2/hr. • A rate of twice normal is considered hyperactivity. Would this patient be considered hyperactive?
Find the approximate point for 12 years of age, follow it to the male line and then follow it to the left…43 calories/m2/hr. 43 x 2 = 86. Our patient would not be considered hyperactive.
Suggested Calorie Intake • Look at the Daily Calorie Allowance Graph • If George I. Buprofen weighs 147 pounds and is 45 years old. What calorie allowance would you suggest he use? • The closest ideal weight is 145, following horizontally across to the 45 year-old column shows 2365. • Now, because our numbers aren’t right on, we’ll estimate the best caloric intake for George…..
The value below it would represent a 156 pound, 45 year old male (2465) Estimate the difference of the two caloric values, 2525 and 2375. (approx. 100 calories) Estimate the difference of the two weights, 145 and 156. (10 lbs.) Divide the calories by the pounds. (100/10=10) This represents the number of additional calories needed per gain of one pound of body weight.
Since George is two pounds over the listed 145 pounds, we would need to add 20 calories to the caloric value of 2365. We should suggest George takes in 2365 calories per day to maintain his body weight. These steps have allowed us to interpolate data from a chart versus the graph we used in the lastproblem.
The Cedar Point Guesstimator • Now we’re on our way to Cedar Point and everyone wants to ride the BLASTER at the same time! BUT, the weight capacity of the BLASTER is only 500 lb. Guesstimate a safe load by estimating average weights for each age group.
4 young children 4 adults 12 college students 9 high school students 50 lbs. Ea. W-150 lbs. M-200 lbs. 150 lbs. Ea. 150 lbs. Ea. The Riders/Average Wt. Who can safely ride together? There may be more than one correct answer.