Download
1 / 30
300 likes | 586 Views
Single Factor Experimental Designs I. Lawrence R. Gordon Psychology Research Methods I. Simplest Experimental Designs: One “IV” with two levels. Independent groups Between-subjects, random assignment Matched groups Between-subjects, block random assignment Nonequivalent groups

E N D
Single Factor Experimental Designs I Lawrence R. Gordon Psychology Research Methods I
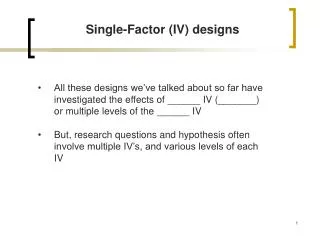
Simplest Experimental Designs:One “IV” with two levels • Independent groups • Between-subjects, random assignment • Matched groups • Between-subjects, block random assignment • Nonequivalent groups • Between-subject, selected person variables • Repeated measures • Within-subjects, assignable levels or “time”
Stroop Experiment BLUE RED GREEN Reading Times (sec) BLACK NC NCWd Reading Instructions
Question:BOWER “DROODLES” EXPERIMENT • Mean # Droodles recalled with no cue = 7.03 C (.91 I) • Mean # Droodles recalled with cue = 8.26 C (.33 I) • ARE THESE MEANS “DIFFERENT”? • YES - why? Later...
Question:CLASS “HAVING FUN” EXAMPLE • MORE Fun mean time estimated = 8.6 • LESS Fun mean time estimated = 12.5 • ARE THESE MEANS “DIFFERENT”? • YES - Why? Later...
ANSWERS • How do we make these “judgments”? • INFERENTIAL STATISTICS • Null hypothesis significance test • An instance of a very general decision scheme
NULL HYPOTHESIS SIGNIFICANCE TESTING • ABSTRACT • Null hypothesis “Chance” (H0) • Alternative hypothesis “Effect” (H1)
ABSTRACT Adapted from Johnson and Christensen (2000). Educational Research. Allyn & Bacon
NULL HYPOTHESIS SIGNIFICANCE TESTING • ABSTRACT • Null hypothesis “Chance” (H0) • Alternative hypothesis “Effect” (H1) • ASSESS • ASSUMING null is true, what is the “chance” (probability) of obtaining the data we did?
ASSESS • Key question: “IF I assume that the null hypothesis is true, is my sample statistic so unlikely that it makes more sense to reject the null hypothesis (and thereby accept the alternative)? • Key concept: the “Sig” or “p =” is the answer to the question “how likely is my result IF the null hypothesis is true?”
NULL HYPOTHESIS SIGNIFICANCE TESTING • ABSTRACT • Null hypothesis “Chance” (H0) • Alternative hypothesis “Effect” (H1) • ASSESS • ASSUMING H0 is true, what is the probability or “chance” of obtaining the data we did • DECIDE • IF the chance is “small enough,” reject H0 and INFER the “Effect” is real (what can go wrong?)
DECIDE • One way to assess: • Compare p (or Sig.) from SPSS to a preselected level of “small enough” (“significance level”) and reject the null if it is equal to or less than that • REJECT NULL if p (usually =.05!) • Example, reject null if p=.037 =.05 (it is!) • NOTE: you select α (usually .05); p is computed from your data! • BUT WHAT CAN GO WRONG? Errors…!
THE DECISION SCHEMEExamples • A major problem is that NO decision is ever “guaranteed” to be right • Some examples: • Fire alarm • Jury trial • NHST
The Decision Scheme: Comments • If the reality is “chance”, we are correct by NOT inferring an effect, or wrong if we do. • TYPE I ERROR: Reject null when null is true • Probability of a Type I error is (alpha) -- the “level of significance” • If the reality is “effect”, we are correct BY inferring an effect, or wrong if we do not. • TYPE II ERROR: Retain null when null is false • Probability of a Type II error is (beta) • More common to use Power = 1 -
Question:BOWER “DROODLES” EXPERIMENT • Mean # Droodles recalled with no cue = 7.03 C (.91 I) • Mean # Droodles recalled with cue = 8.26 C (.33 I) • ARE THESE MEANS “DIFFERENT”? • YES - why?
ANSWERS REVISITEDBower Experiment F’02 INFERENTIAL STATISTICS
Question:CLASS “HAVING FUN” EXAMPLE • MORE Fun mean time estimated = 8.6 • LESS Fun mean time estimated = 12.5 • ARE THESE MEANS “DIFFERENT”? • YES - Why?
ANSWERS REVISITED“Having Fun” Example Inferential Statistics
A New Example – from scratch:Doob and Gross (1968)... • Status of frustrator as an inhibitor of horn-honking responses. J Social Psychology, 76, 213-218. • IV: Low vs. high status car • DV: Latency of following car to honk when light turns green and car doesn’t move (seconds) • Results: • Low-status -- N=15, = 7.12 (2.77) sec • High-status -- N=20, = 9.23 (2.82) sec • SPSS output and interpretation
NHST: Two Independent Means • ABSTRACT • H0 “chance”: 1 = 2 OR 1 - 2 = 0 • H1 “effect”: 1 2 OR 1 - 2 0 • ASSESS • ASSUMING H0 is true, what is the probability or “chance” of the empirical sample outcome? • Compute independent-sample t; note the “p = ”. • DECIDE • IF the chance is “small enough,” reject H0; otherwise do not. • If p(t|Null) (=.05), reject null and interpret alternative.
Repeated-measuresDefinitional Example • “Family therapy for anorexia” (1994) • Before and after family therapy - weights • Using SPSS • t-test on paired -samples • Was there a change?
Repeated-measuresDefinitional Example • “Family therapy for anorexia” (1994) • SPSS -- standard analysis for paired-samples:
Can a Machine Tickle? • Reference: Harris & Christenfeld (1999) Psychonomic Bull. & Rpts. • Problem: Why can’t you tickle yourself? Reflex vs Interpersonal explanations. Review of long history and more recent research. • Method: 21 & 14 - UCSD undergrads, age 18-28. Tickled twice on foot by “machine” vs “person” (both really a person). Measured by both self-report and behavior rating of video. Open answers to “was sensation produced by the E different than [that] produced by the machine?”
Can a machine, cont… • Results: interrater reliability, descriptives in table, inferential tests in text of article: • “There was no hint of any difference between tickle responses produced by the experimenter and by the machine for behavior [t(32)=0.27, n.s.] or self-report [t(32)=0.12, n.s.].” • Discussion: • “generally favorable to the view that the tickle response is some form of innate stereotyped motor behavior, perhaps akin to a reflex” • suggests “that ticklish laughter itself does not require any belief that another human being is producing the stimulation.”
NHST: Two Related Means • ABSTRACT • H0 “chance”: 1 - 2 = 0 OR 1 = 2 • H1 “effect”: 1 - 2 0 OR 1 2 • ASSESS • ASSUMING H0 is true, what is the probability or “chance” of the empirical sample outcome? • Compute related-sample t; note the “p = ”. • DECIDE • IF the chance is “small enough,” reject H0; otherwise do not. • If p(t|Null) (=.05), reject null and interpret alternative.
REVIEW & SUMMARY • Two-level single factor (IV) designs: • Independent groups * • Nonequivalent groups * • Matched groups ** • Repeated measures ** • * use t-test for independent means • ** use t-test for paired means