Download
1 / 21
210 likes | 491 Views
Steps in a Design Brief. Lumberton High School Sci Vis I V105.02. Design Brief. It is the steps used to create an effective visualization Problem, identification, and definition Establish a clear idea of what is to be accomplished. Identify the intended audience.

E N D
Steps in a Design Brief Lumberton High School Sci Vis I V105.02
Design Brief • It is the steps used to create an effective visualization • Problem, identification, and definition • Establish a clear idea of what is to be accomplished. • Identify the intended audience. • Identify and define the specific problem.
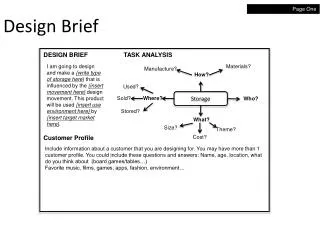
Problem, Identification, and Definition Establish a clear idea of what is to be accomplished. Identify the intended audience. Identify and define the specific problem.
Plan of work A written step-by-step process by which the goal is to be accomplished. The plan can include expected time for completion. The plan should include any division of work among team members.
Research and Review of the Literature Includes complete topic research of available literature. Remember to document resources.
Hypothesis • Form a proposed solution to the problem. • Use an if/then statement if necessary. • A Storyboard or sketch should be developed if needed. • A pictorial sequence of events. • May include text and direction, as well as audio and video techniques. • Sketch-a quick drawing to illustrate your idea.
Data collection (if applicable) Collect data from experimentation or other appropriate means. Organize data in appropriate charts and graphs.
Identification of Appropriate Scientific Theory and Visualization Concepts • Select the most appropriate visualization method to present the theory or data. • For example, the process of mitosis may be effectively demonstrated using presentation software, such as PowerPoint. • Explain the rationale behind the selection. • Example: PowerPoint allows the user to show the sequence of stages in mitosis.
Student Evaluation of the Design and Visualization Students perform self-evaluation pointing out areas of difficulty. Pinpoint successes and failures in the project. Offer suggestions on how the project could be improved.
Presentation Present project to the class. Distribute an appropriate handout if needed.
Sample Evaluation Criteria/Rubric Design brief Statement of Problem __________ 5% Plan of Work __________ 10% Research __________ 15% Accuracy of Information _________ 15% Visualization __________ 20% Presentation __________ 10% Creativity __________ 10% Student self-evaluation __________ 15% Total Possible points 100 points
“IDEAL” problem solving process • I -- Identify the problem • D -- Define the plan of work • E -- Explore the problem through research • A -- Act on the problem’s possible solution • L -- Look back at the process
“SAFE” design process • S -- Simple. Keep your design simple. • It will save you time and money. • You are less likely to have problems with the presentation. • A -- Appropriate. Make sure that it is appropriate for its purpose. • You need to make it as complex or simple for younger and older viewers so that they understand the presentation. • F -- Functional. Does the presentation work? Does it do what you want it to? • If a visual confuses an audience more than it helps them to understand the topic, then it is not performing its function. • E -- Economical. Make sure you spend time on things that are important.
Different types of design • Data-driven • design that uses data in the form of numbers or values. • Examples: graphs, charts, and tables.
Different types of design • Concept-driven • design that explains a concept, idea or theory. • Examples: how a car works, the water cycle, or a drawing of a tree.
Flowcharting • A visualization method for displaying relationships in time or a process. • Steps can be demonstrated with symbols • The flow process can be shown with arrows. • Flowcharts can help determine problems with a process. • logical steps, • delays, • dead ends or • miscommunication problems
Brainstorming • Process that identifies as many answers to a problem as possible. • submitting ideas without criticism or • discussion of feasibility. • will normally have a moderator and a recorder.
Nominal group technique • Organizational tool used to show the relative importance of issues, problems, or solutions by allowing individuals to rank each item. • Numerical values are generally used.
Venn Diagram • Organization tool used to show similarities and differences among sets of items.