Download

1 / 16
170 likes | 340 Views
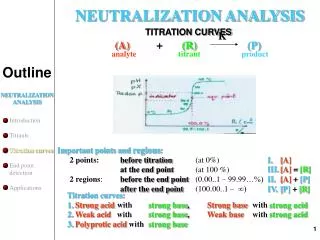
Acidity Constant by pH Titration Curves. Quiz Lecture Lab!. Titrations: Endpoints. Three ways to determine endpoint: Perform a calculation using M 1 V 1 =M 2 V 2 Calculation – Theoretical Using the visual indicator (phenolphthalein) Experimentally Use a titration curve

E N D
Quiz • Lecture • Lab!
Titrations: Endpoints • Three ways to determine endpoint: • Perform a calculation using M1V1=M2V2 • Calculation – Theoretical • Using the visual indicator (phenolphthalein) • Experimentally • Use a titration curve • Experimental with calculations • You will be comparing the accuracy of visual indicator vs. pH curve to the theoretical value
NEW EQUIPMENT: pH Meter • Turn the knob to “pH” • Make sure glass bulb is consistently wet To standardize • Rinse bulb briefly with dH2O, blot with paper towel gently • Submerge the pH stick in the pH 7 buffer solution solution, be sure to have bulb well in solution • Adjust pH knob to the standard solution pH 7.
Procedure Part A Titrate HCl with NaOH • Calibrate the pH meter with pH 7 buffer (just use “standardize” knob if necessary) • Rinse a graduated cylinder with HCl and add 25 mL HCl to an Erlenmeyer flask • Add a few drops of phenolphthalein to HCl • Rinse a buret with NaOH, fill with NaOH, and deliver NaOH in increments of 2mL into flask, recording pH
Remember you are noting the pH endpoint AND visual endpoint • At ~20 mL decrease to ~0.4 mL increments (the equivalence point is around here!!) • Note the volume in which you reached visual endpoint (pink) • Record pH until pH is 10, then increase increments to 2 mL till pH probe reads consistent numbers
Procedure Part B Titrate CH3COOH with NaOH • Same procedure but with 25 mL acetic acid + indicator in Erlenmeyer flask! • Titrate with the NaOH from the buret
WARNING!!! • DO NOT use a beaker for this experiment! • DO NOT stir solution with pH probe! • Add NaOH, gently remove buret from flask, swirl solution, insert pH probe, record value. • For best results, record buret to the nearest 0.0x mL
End of Lab • Pour solutions down the sink • Clean your lab station • Turn off pH meter, make sure to keep pH stick and glass bulb in the buffer solution cup • Check with lab prep to clean up • Turn in yellow copies (pre-lab and filled in data tables and observations)
Due in TWO weeks • Next week you have spring break…which means no lab • But in two weeks a formal lab is due • ….that and the pre-lab/ quiz for Expt 8. Molar Solubility and the Common-Ion Effect
Formal Lab Report • Title Page • Data Table (excel) • NaOH + HCl raw data pH vs. volume NaOH • NaOH + Acetic Acid raw data pH vs. volume NaOH added • Bold the volume amount of NaOH in which you got a pink endpoint.
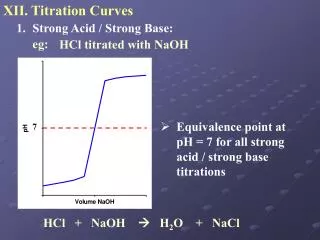
Graphs • 2 graphs: one for HCl and one for Acetic Acid • Make a calibration curve pH (Y-axis) vs. Volume NaOH (mL) • Mark the pH equivalence point, the phenolphthalein equivalence point, and the half-neutralization point/pKA for each graph.
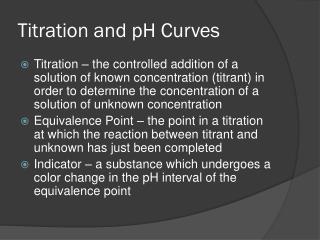
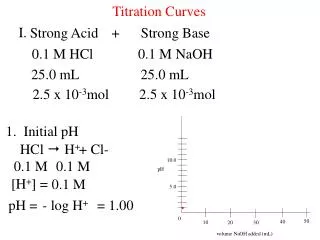
Titration Curve HCl titrated with NaOH (p. 166)
Calculations – graph • Sample calculations for BOTH HCl and Acetic Acid – phenolpthalein, theoretical, graph • Titration curve -- graph • Justify how you found the equivalence point, the volume of equivalence point, and its correlating pH. • Find Ka • Remember pKa = pH @ Volume of Ka • Ka = 10^-pKa
Calculations Sample calculations for BOTH HCl and Acetic Acid – phenolpthalein, theoretical, graph • Phenolphthalein endpoint – find volume equiv point • Get volume final volume - initial volume of NaOH added • Theoretical endpoint – find volume equiv point • use Macid*Vacid=Mbase*Vbase
Conclusions • 1 page -- refer to lab report outline for general questions and how to do in depth analysis • Analyze graph, why you use it? • Compare Ka of acetic acid versus HCl • Compare Vol Equivalence pt of pH meter vs. phenolphthalein, which is more accurate? • Error analysis -- what happened experimentally that can affect the values