Download
1 / 3
30 likes | 173 Views
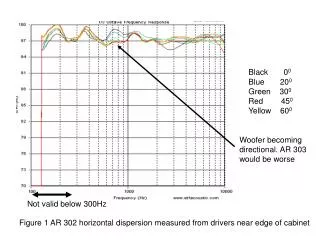
GAMES WON PER SEASON BY THE CAVALIERS 2004-2010. 4. 3. 2. Frequency. 1. 0. 0-20. 21-40. 41-60. 61-80. Data Range. How to make a histogram How to make a Frequency Table (can be sideways, or straight up). Step 1: The frequency table has three columns and a label.

E N D
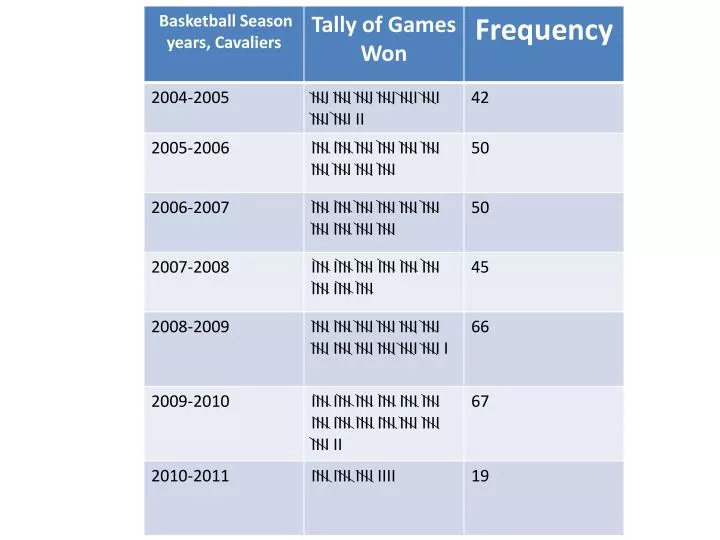
GAMES WON PER SEASON BY THE CAVALIERS 2004-2010 4 3 2 Frequency 1 0 0-20 21-40 41-60 61-80 Data Range
How to make a histogram How to make a Frequency Table (can be sideways, or straight up). Step 1:The frequency table has three columns and a label. Step 2: The first column must have the item. Step 3: The second column is filled with tally marks of how many times that item has or had occurred. Step 4: And now the third column is the amount of times the item occurred or the Frequency of the item. Step 5: And finally you label your frequency table. How to make a Histogram Step 1: First you have to make a frequency table (can be sideways, or straight up). Step 2: First you make a box Step 3: Label the top of your box with what you labeled your frequency table. Step 4: Label the side of the box “Frequency” and the bottom “Data Range”. Step 5: Then you make a range of numbers at the bottom for the different columns for instance 1-20, 21-40, 41-60… Step 6: Then you add some numbers on the side for the amount of times or the Frequency of how often the numbers in each range occurred. Step 7: Finally you Transfer the information from your frequency table into your histogram. Step 8: And now, you’ve finally made your Histogram!!!!!!!!!!