Download
1 / 30
300 likes | 346 Views
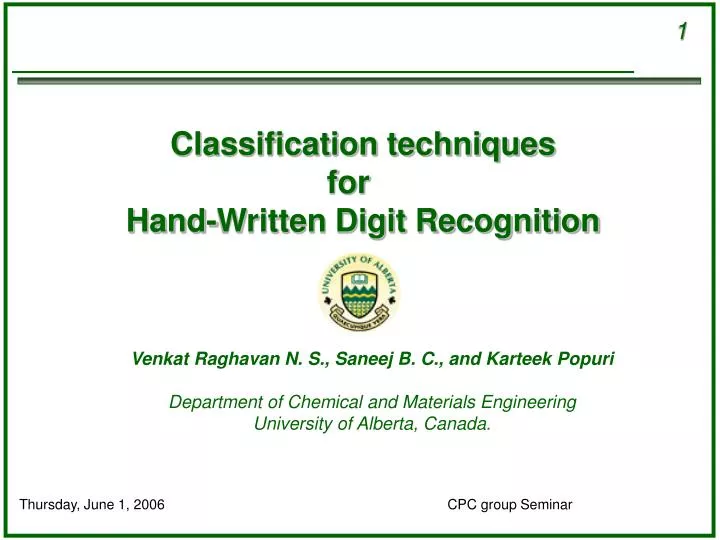
Classification techniques for Hand-Written Digit Recognition. Venkat Raghavan N. S., Saneej B. C., and Karteek Popuri Department of Chemical and Materials Engineering University of Alberta, Canada. Optical Character Recognition (OCR)

E N D
Classification techniques for Hand-Written Digit Recognition Venkat Raghavan N. S., Saneej B. C., and Karteek Popuri Department of Chemical and Materials Engineering University of Alberta, Canada. CPC group Seminar
Optical Character Recognition (OCR) Predict the label of each image using the classification function learned from training OCR is basically a classification task on multivariate data Pixel Values Variables Each type of character Class Introduction Objective: To recognise images of Handwritten digits based on classification methods for multivariate data. CPC group Seminar
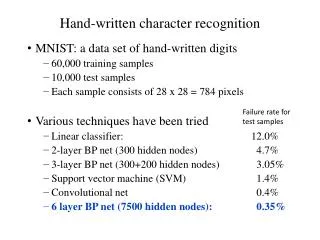
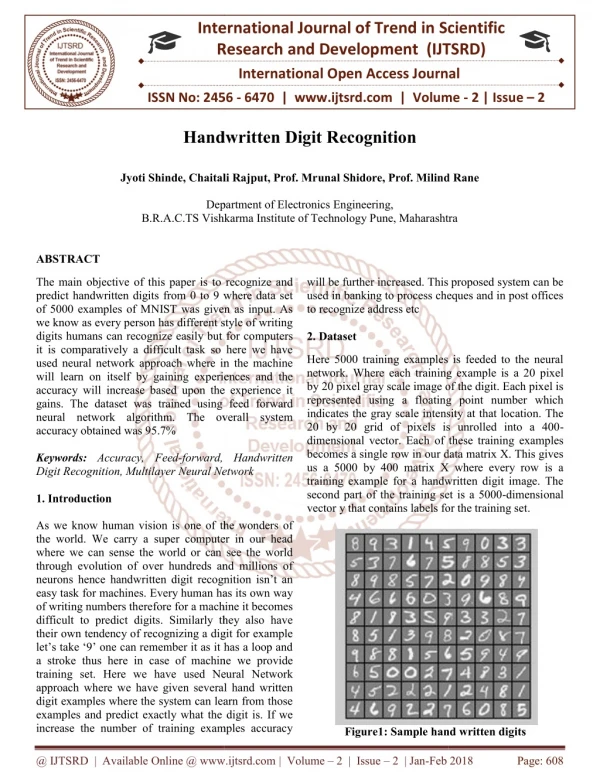
xij 16 16 Handwritten Digit data • 16 x16 (= 256 pixel) Grey Scale images of digits in range 0-9 • Xi=[xi1, xi2, ……. xi256] • yi { 0,1,2,3,4,5,6,7,8,9} • 9298 labelled samples • Training set ~ 1000 images • Test set • Randomly selected from the full data base • Basic idea – Correctly identify the digit given an image CPC group Seminar
PCA done on the mean centered images The eigenvectors of∑256x256matrix arecalled the Eigen digits (256 dimensional) The larger an Eigen value the more important is that Eigen digit. The ith PC of an image X is yi=ei’X Dimension reduction - PCA AVERAGE DIGIT CPC group Seminar
Based on the Eigen values first 64 PCs were found to be significant Variance captured ~ 92.74% Any image represented by its PC: Y= [y1 y2….....y64 ] Reduced Data Matrix with 64 variables Y = 1000 x 64 matrix PCA (continued…) CPC group Seminar
The Eigen vectors are the rotation of the original axes to more meaningful directions. The PCs are the projection of the data onto each of these new axes. Image Reconstruction: The original image can be reconstructed by projecting the PCs back to old axes. Using the most significant PC will give a reconstructed image that is close to original image. These features can be used for carrying out further investigations e.g. Classification!! Interpreting the PCs as Image Features CPC group Seminar
Normality test on PCs CPC group Seminar
Principle Components used as features of images LDA assuming multivariate normality of the feature groups and common covariance Fisher discriminant procedure which assumes only common covariance Classification CPC group Seminar
Equal cost of misclassification Misclassification error rate: APER based on training data AER on the validation data Error rate using different number of PCs were compared Classification (contd..) Averaged over several random sampling of training and validation data from the full data set. CPC group Seminar
Performing LDA • Prior probabilities of each class were taken as the frequency of that class in data. • Equivalence of covariance matrix • Strong Assumption • Error rates used to check validity of assumption • Spooled used for covariance matrix CPC group Seminar
LDA Results • APER • AER • APER underestimates the AER • Using 64 PCs is better than using 150/256 PCs! • The PCs with lower Eigen values tend to capture the noise in the data. CPC group Seminar
Uses equal prior probabilities, covariances. No of discriminants can be r <= 9 When all discriminants are used Fischer equivalent to LDA (verified by error rates) i.e. when r=9 Error rates with different r compared Fisher Discriminants CPC group Seminar
Fisher Discriminant Results r=2 discriminants APER AER • Both AER and APER are very high CPC group Seminar
Fisher Discriminant Results r=7 discriminants APER AER • Considerable improvement in AER and APER • Performance is close to LDA • Using 64 PCs is better CPC group Seminar
Fisher Discriminant Results r=9(all) discriminants APER AER • No significant performance gain from r=7 • Error rates are ~ LDA (as expected!) CPC group Seminar
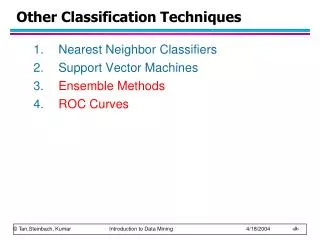
No assumption about distribution of data Euclidean distance to find nearest neighbour Nearest Neighbour Classifier • Finds the nearest neighbours from the training setto test image and assigns its label to test image. Test point assigned to Class 2 Class 1 Class 2 CPC group Seminar
Compute the k nearest neighbours and assign the class by majority vote. K-Nearest Neighbour Classifier (KNN) k = 3 Test point assigned to Class 1 Class 1 ( 2 votes ) Class 2 ( 1 vote ) CPC group Seminar
1-NN Classification Results: • Test error rates have improved compared to LDA and Fisher • Using 64 PCs gives better results • Using higher k’s does not show improvement in recognition rate CPC group Seminar
Misclassification in NN: • Euclidean distances between transformed images of same class can be very high CPC group Seminar
Expensive:To determine the nearest neighbour of a test image, must compute the distance to all N training examples Storage Requirements: Must store all training data Issues in NN: CPC group Seminar
Euclidean-NN method inefficient • Store all possible instances (positions, sizes, angles, thickness, writing styles…), • this is impractical. CPC group Seminar
Euclidean distance metric fails Pattern to be classified Prototype A Prototype B • Prototype B seems more similar than Prototype A according to Euclidean distance. • Digit “9” misclassified as “4”. • Possible solution is to use an distance metric invariant to irrelevant transformations. CPC group Seminar
Effect of a Transformation Pixel Space X + α . X s (X, α) SX = { y | there exists α for which y = s (X, α) } CPC group Seminar
Tangent Distance Tangent distance P SP Euclidean distance between P and E Distance between SP and SE SE E CPC group Seminar
Images in tangent plane Rotation Scaling Thickness X Translation Diag. Deformation Axis Deformation Y Translation CPC group Seminar
The vectors tangent to the manifold SX form the hyper plane TX tangent to SX. The Tangent distance D(E,P) is found by minimizing distance between TE and TP. The images are smoothed with a gaussian σ = 1. Implementation CPC group Seminar
Implementation (Contd…) The Equations of TP and TE are given by where CPC group Seminar
Implementation (Contd…) Solving for αP and αE we can calculate D(E,P) the Tangent Distance between two patterns E and P. CPC group Seminar
USPS data set ,1000 training examples and 7000 test examples. The misclassification error rate using 3-NN is 3.26 %. The time taken is 9967.94 sec. Tangent Distance method Results CPC group Seminar
“The Elements of Statistical Learning- Data Mining, Inference and Prediction” by Trevor Hastie, Robert Tibshirani, Jerome Friedman “Applied Multivariate Statistical Analysis” by Richard A. Johnson, Dean W. Wichern. http://www.robots.ox.ac.uk/~dclaus/ “Transformation Invariance in Pattern Recognition – Tangent Distance and Tangent propagation” by Patrice Y. Simard, Yann A. Le Cun . References: CPC group Seminar