Download
1 / 16
160 likes | 317 Views
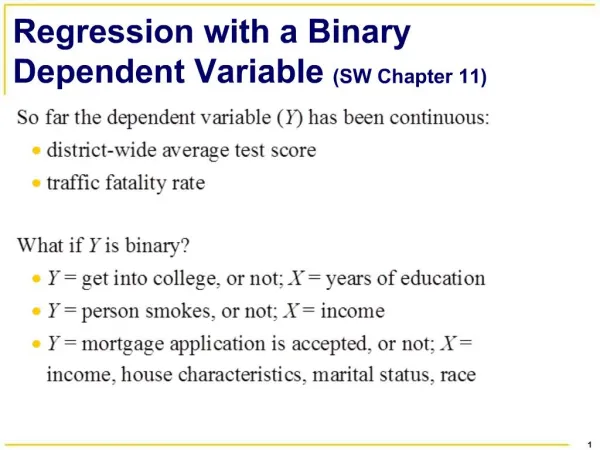
Regression with a Binary Dependent Variable. Introduction. What determines whether a teenager takes up smoking? What determines if a job applicant is successful What determines if a loan application is denied Why do some people go to college and others don’t?

E N D
Introduction • What determines whether a teenager takes up smoking? • What determines if a job applicant is successful • What determines if a loan application is denied • Why do some people go to college and others don’t? • Why do some people buy houses while others rent?
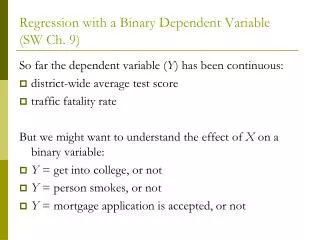
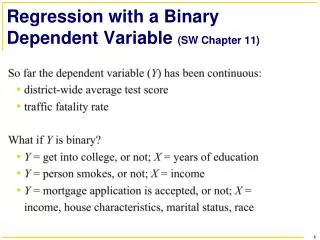
In all these examples, the outcome is a qualitative response or a binary choice e.g. the teenager does or does not take up smoking etc. Y – dependent variable is assigned a value of 1 if the event occurs and 0 otherwise. Interpret the regression as modeling the probability that the dependent variable is equal to 1
The Linear Probability Model • Simplest binary choice model • The probability of the event occurring, p, is assumed to be a linear function of the explanatory variable(s)
Factors influencing graduation from high school Y = GRAD =1 for those who graduate, 0 otherwise X = AVSCR Composite test score on provincial exam Minimum = 20, scaled with a mean of 50 and a standard deviation of 10
Linear Probability Model Using OLS:
Interpretation • The probability of graduating from high school increases by a proportion of 0.007, or 0.7% for every 1 point increase in score • A one standard deviation increase in score will increase the probability of graduating by ????% • If the score was zero, the probability of graduating is ????? • Is the intercept meaningful??
Discrimination???? Y = deny (binary variable equal to 1 if a loan application is denied and 0 otherwise PI = ratio of applicant’s anticipated total monthly loan payments to his or her monthly income black = binary regressor equal to 1 if applicant is black and 0 otherwise
Interpretation • A white applicant with a 30% PI • If Does the estimate suggest that they might be racial bias in mortgage decisions? Explain fully
Problems with the model • The error term is not a continuous distribution. Neither is it normal • If OLS is used, the standard errors and the usual test statistics are invalidated • The distribution is heteroscedastic because error term changes with the independent variable • The predicted value for Y, may be greater than 1 or less than 0 for extreme values of X
Solutions • Use MLE techniques to estimate coefficients a. Probit estimation – uses cumulative normal distribution function b. Logit estimation - uses logistic function These use non-linear techniques to estimate the regression function. Estimates are efficient, consistent and normally distributed in large samples so tests can be constructed in the usual way
Probit Regression • With a single regressor X is Where Ф is the cumulative standard normal (z) distribution function
An Example The coefficients are difficult to interpret (but the signs and statistical significance are not) because they affect the probability of denial through the z-value. If β1 is positive then an increase in X will increase the probability that Y =1. If negative then an increase in X will decrease the probability of Y=1 Interpret test of significance as usual
Calculating probabilities • What is the probability of denial for an applicant with PI= 30% = Ф(-2.91+2.97*0.3) =Ф(-1.30) = P(z<-1.30) =0.097 The probability that the application will be denied if the applicant’s PI is 30% equals 9.7% What is the change in predicted probability when PI ratio increases from 0.4 to 0.5?
Check Comment on the coefficient of black.? What is the difference in predicted denial probability between a white applicant with 30% PI ratio and a black applicant with the same ratio?
Missing Observations • Collect data on Sleep and Age • All data on Sleep but 20% of Age is missing • How do you use all the data to show the effect of Age on Sleep?