Download
1 / 1
10 likes | 137 Views
S 1. h n. m 10. h n. S 0. S f. G f. m fi. h n. S i. m i0. h n. S 0. m 1. m 0.

E N D
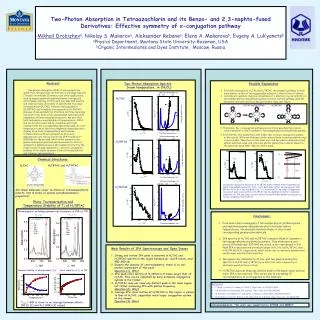
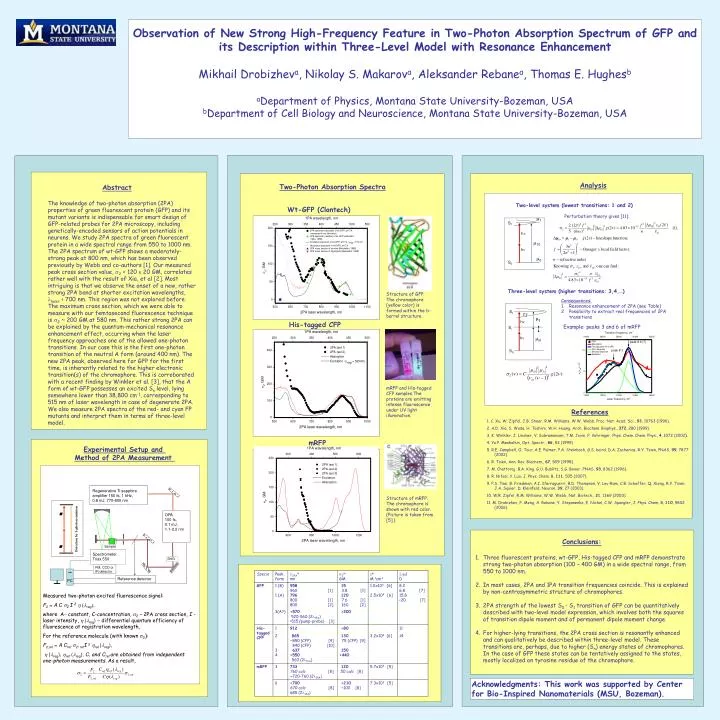
S1 hn m10 hn S0 Sf Gf mfi hn Si mi0 hn S0 m1 m0 Observation of New Strong High-Frequency Feature in Two-Photon Absorption Spectrum of GFP and its Description within Three-Level Model with Resonance EnhancementMikhail Drobizheva, Nikolay S. Makarova, Aleksander Rebanea, Thomas E. HughesbaDepartment of Physics, Montana State University-Bozeman, USAbDepartment of Cell Biology and Neuroscience, Montana State University-Bozeman, USA Analysis Two-Photon Absorption Spectra • Abstract • The knowledge of two-photon absorption (2PA) properties of green fluorescent protein (GFP) and its mutant variants is indispensable for smart design of GFP-related probes for 2PA microscopy, including genetically-encoded sensors of action potentials in neurons. We study 2PA spectra of green fluorescent protein in a wide spectral range from 550 to 1000 nm. The 2PA spectrum of wt-GFP shows a moderately-strong peak at 800 nm, which has been observed previously by Webb and co-authors [1]. Our measured peak cross section value, s2 = 120 ± 20 GM, correlates rather well with the result of Xia, et al [2]. Most intriguing is that we observe the onset of a new, rather strong 2PA band at shorter excitation wavelengths, llaser < 700 nm. This region was not explored before. The maximum cross section, which we were able to measure with our femtosecond fluorescence technique is s2 ~ 200 GM at 580 nm. This rather strong 2PA can be explained by the quantum-mechanical resonance enhancement effect, occurring when the laser frequency approaches one of the allowed one-photon transitions. In our case this is the first one-photon transition of the neutral A form (around 400 nm). The new 2PA peak, observed here for GFP for the first time, is inherently related to the higher electronic transition(s) of the chromophore. This is corroborated with a recent finding by Winkler et al. [3], that the A form of wt-GFP possesses an excited Sn level, lying somewhere lower than 38,800 cm-1, corresponding to 515 nm of laser wavelength in case of degenerate 2PA. We also measure 2PA spectra of the red- and cyan FP mutants and interpret them in terms of three-level model. Two-level system (lowest transitions: 1 and 2) Wt-GFP (Clontech) Perturbation theory gives [11]: Three-level system (higher transitions: 3,4,…) Structure of GFP. The chromophore (yellow color) is formed within the b-barrel structure. • Consequences: • Resonance enhancement of 2PA (see Table) • Possibility to extract real frequencies of 2PA transitions His-tagged CFP Example: peaks 3 and 6 of mRFP mRFP and His-tagged CFP samples.The proteins are emitting intense fluorescence under UV light illumination. References 1. C. Xu, W. Zipfel, J.B. Shear, R.M. Williams, W.W. Webb, Proc. Nat. Acad. Sci., 93, 10763 (1996). 2. A.D. Xia, S. Wada, H. Tashiro, W.H. Huang, Arch. Biochem. Biophys., 372, 280 (1999). 3. K. Winkler, J. Lindner, V. Subramaniam, T.M. Jovin, P. Vohringer, Phys. Chem. Chem. Phys., 4, 1072 (2002). 4. Yu.P. Meshalkin, Opt. Spectr., 86, 53 (1999). 5. R.E. Campbell, O. Tour, A.E. Palmer, P.A. Steinbach, G.S. baird, D.A. Zacharias, R.Y. Tsien, PNAS, 99, 7877 (2002). 6. R. Tsien, Ann. Rev. Biochem., 67, 509 (1998). 7. M. Chattoraj, B.A. King, G.U. Bublitz, S.G. Boxer, PNAS, 93, 8362 (1996). 8. R. Nifosi, Y. Luo, J. Phys. Chem. B, 111, 505 (2007). 9. P.S. Tsai, B. Friedman, A.I. Ifarraguerri, B.D. Thompson, V. Lev-Ram, C.B. Schaffer, Q. Xiong, R.Y. Tsien, J.A. Squier, D. Kleinfeld, Neuron, 39, 27 (2003). 10. W.R. Zipfel, R.M. Williams, W.W. Webb, Nat. Biotech., 21, 1369 (2003). 11. M. Drobizhev, F. Meng, A. Rebane, Y. Stepanenko, E. Nickel, C.W. Spangler, J. Phys. Chem. B, 110, 9802 (2006). mRFP Experimental Setup and Method of 2PA Measurement Regenerative Ti:sapphire amplifier 150 fs, 1 kHz, 0.8 mJ, 770-800 nm Structure of mRFP. The chromophore is shown with red color. (Picture is taken from [5].) n OPA 100 fs, 0.1mJ, 1.1-2.2 nm Detection by 1-photon emission • Conclusions: • Three fluorescent proteins, wt-GFP, His-tagged CFP and mRFP demonstrate strong two-photon absorption (100 – 400 GM) in a wide spectral range, from 550 to 1000 nm. • 2. In most cases, 2PA and 1PA transition frequencies coincide. This is explained by non-centrosymmetric structure of chromophores. • 2PA strength of the lowest S0 - S1 transition of GFP can be quantitatively described with two-level model expression, which involves both the squares of transition dipole moment and of permanent dipole moment change. • For higher-lying transitions, the 2PA cross section is resonantly enhanced and can qualitatively be described within three-level model. These transitions are, perhaps, due to higher (Sn)energy states of chromophores. In the case of GFP these states can be tentatively assigned to the states, mostly localized on tyrosine residue of the chromophore. n Sample Spectrometer Triax 550 SHG PM, CCD or IR detector Reference detector PC Measured two-photon excited fluorescence signal: F2 = A C s2I 2h (lreg), where A- constant, C-concentration, s2 – 2PA cross section, I - laser intensity, h(lreg) – differential quantum efficiency of fluorescence at registration wavelength, For the reference molecule (with known s2): F2,ref = A Crefs2, refI 2href(lreg), h (lreg), href (lreg), C, and Cref are obtained from independent one-photon measurements.As a result, Acknowledgments: This work was supported by Center for Bio-Inspired Nanomaterials (MSU, Bozeman).