Download
1 / 5
50 likes | 154 Views
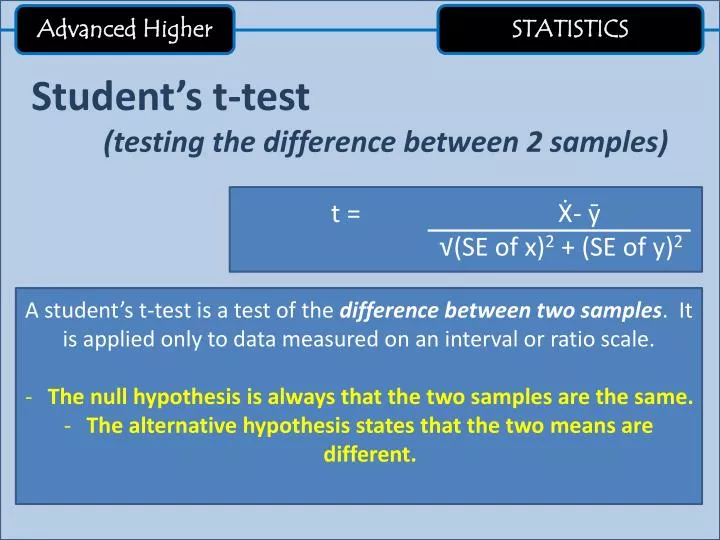
STATISTICS. Advanced Higher. Student’s t-test (testing the difference between 2 samples) . A student’s t-test is a test of the difference between two samples . It is applied only to data measured on an interval or ratio scale.

E N D
STATISTICS Advanced Higher Student’s t-test (testing the difference between 2 samples) • A student’s t-test is a test of the difference between two samples. It is applied only to data measured on an interval or ratio scale. • The null hypothesis is always that the two samples are the same. • The alternative hypothesis states that the two means are different. t = Ẋ- ӯ √(SE of x)2 + (SE of y)2
STATISTICS Advanced Higher Is there a difference between the two sets of data? BIRTH RATE IN LEDCs BIRTH RATE IN MEDCs Switzerland Germany Norway France Spain Italy Japan New Zealand Colombia Zambia Egypt Kenya Ethiopia Mali USA India Brazil Bangladesh Use the students t-test to see if there is a significant difference, or not.
Use the students t-test to see if there is a significant difference, or not Null Hypothesis:there is no significant difference between the mean birth rates of more developed and less developed countries. -2 4 -10 Switzerland - 12 100 Colombia - 30 11 121 -4 16 Germany - 10 Zambia - 51 -5 25 Norway - 13 -1 1 Egypt - 35 8 France - 14 64 0 Kenya - 48 0 -5 25 2 Japan - 16 4 India - 35 4 16 -11 121 New Zealand - 18 Brazil - 29 -7 USA - 15 49 1 Bangladesh - 33 1 Spain - 16 100 10 Alternative Hypothesis:there is a significant difference between the mean birth rates of more developed and less developed countries. Ethiopia - 50 2 4 9 Italy - 12 81 -2 Mali - 49 4 126 126 50 686 9 9 76.2 5.56 14 14 8.73 2.36 2.36 √9 8.73 √9 √ √ 0.786 2.910
Null Hypothesis:there is no significant correlation between percentage of soil moisture and altitude. Alternative Hypothesis:there is a significant correlation between percentage of soil moisture and altitude. t = -8.625 Now look to see if the calculated value of t is higher or lower than the critical value. t = Ẋ- ӯ √(SE of x)2 + (SE of y)2 t = 14 - 40 √0.617 + 8.469 t = -26 √9.086 NOTE: The t-value can be positive or negative. For this test we can ignore the sign and just use the figure when we compare it against the critical value
t = -8.625 Null Hypothesis:there is no significant correlation between percentage of soil moisture and altitude. Calculate degrees of freedom (nx – 1) + (ny – 1) (9-1) + (9-1) = 16 Alternative Hypothesis:there is a significant correlation between percentage of soil moisture and altitude. 16 The calculated value of t is 8.62 which is higher than the critical value of 2.12 (95% confidence) and 2.92 (99%) so we can reject the null hypothesis and accept the alternative hypothesis that there is a significant difference between developing and developed countries birth rates.