Download
1 / 53
540 likes | 722 Views
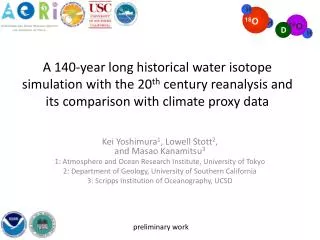
H. 18 O. H. 16 O. D. H. A 140-year long historical water isotope simulation with the 20 th century reanalysis and its comparison with climate proxy data. Kei Yoshimura 1 , Lowell Stott 2 , and Masao Kanamitsu 3 1: Atmosphere and Ocean Research Institute, University of Tokyo

E N D
H 18O H 16O D H A 140-year long historical water isotope simulation with the 20th century reanalysis and its comparison with climate proxy data Kei Yoshimura1, Lowell Stott2, and Masao Kanamitsu3 1: Atmosphere and Ocean Research Institute, University of Tokyo 2: Department of Geology, University of Southern California 3: Scripps Institution of Oceanography, UCSD preliminary work
Seager et al., 2007 Will the Dust Bowl era become the new climatology??
Bristlecone pine tree at SE CA δ18O in cellulose seems good indicator for historical drought events, but not for the current drought. Berkelhammer et al., 2009; Stott and Yoshimura, in prep
Motivation • Specific: Is the current SW-US drought attributable to the global warming? Is the isotopic data able to tell the uniqueness of this event? • General: How accurate are isotopic proxies to reconstruct the recent climate? Is there any change in the relationships?
Stable Water Isotopes and Hydrologic Cycle • SWI have integrated records of phase changes during its transport. Iso. Var. H Iso Var. (‘Light’ Water)Easy to evaporate 16O H H2O (‘Heavy’ Water)Easy to condense < H Iso Var 18O 16O D H H H218O HDO 0.20% 0.016% River Flow “Fractionation” causes large heterogeneity in time and space. Recorded in: ice core, coral, cellulose, etc.etc.
GNIPObservation (1960s-, WMO/IAEA) • Found good correlation between precipitation isotopes and surface temperature at mid-high latutude and precipitation amount at low latitude (Dansgaard, 1964).Justification for Paleoclimate reconstruction
Isotopes are useful… • To interpret past and current climate information from ice cores, corals, stalagmite, etc., in various spatial/temporal scales. • To detect an erroneous hydrologic process in the model and/or evaluate the model / reanalyses in an integrated manner.
Isotope studies are hot these daysdue to new remote sensing technology Potential for direct data assimilation for isotopes!! different ongoing study
Isotopes in GCM/RCM Typical convective precipitation process • Incorporate water isotopes as passive tracers in GCMs/RCMs. Whenever water phase change takes place, isotopic water (HDO, H218O) behave differently to ordinary water (H2O). Courtesy of JMA Risi et al. 2008
Previous works Spectral Nudging + Isotope GSM– Poor man’s data assimilation for isotopes – http://meteora.ucsd.edu/~kyoshimura/IsoGSM1 Use large scale (>1000km) winds from R2 to constrain dynamical field, so that the isotopic field is also constrained and reproduced in daily to inter-annual time scales. Yoshimura and Kanamitsu, 2008; Yoshimura et al., 2008
Comparison with GNIP Climatology • Many other verification studies available.Uemura et al., 2008; Abe et al., 2009; Frankenberg et al., 2009; Pfahl and Wernli, 2009; Schneider et al, 2010; Galewskyand Hurley, 2010; Yoshimura et al., 2010, Berkelhammer et al., 2011; etc.
Comparison with Bristlecone δ18O nudged free Bristlecone pine tree at SE CA Extension of simulation needed!!
20th century Reanalysis (Compo et al., 2010) 1 December 1918 • Using only surface pressure data historically recorded since 1870’s • Ensemble Kalman Filter for data assimilation (56 member) • T62L28 GFS with NOAH LSM SLP 500 hPa GPH Whitaker et al. (2009) • Reanalysis skill is comparable to current Day-3 forecast skill (Whitaker et al., 2009)
Simulation Design • Model: IsoGSM(Yoshimura et al., 2008) & River (Yoshimura et al., 2004) & SimpleBiochem(Roden et al., 2000) • Atmospheric forcing: 20C Reanalysis (Compo et al., 2010) spectral files, 6-hourly ensemble mean field • Boundary forcing: HadISST • Period: 1871-2008 • Stream 1: 1871-1980 • Stream 2: 1979-2008 (for comparison with Y08)
Results • Performance in the recent decades ( poster available) • Comparison in global means with other global datasets • Comparison with GNIP monthly precipitation isotope data • Isotope signal related with AO • Isotope signal related with ENSO • Comparison with >100-year proxy isotope data • Tree-ring cellulose δ18O in Cambodia • Coral δ18O near Philippines
Comparison with GNIP data Bad Good Bad Good
coral-derived δ18Osw vs. modeled δ18Osw(Annual average) Indonesia (2N 125E) modeled δ18Osw Philippine (13N 124E) coral-derived δ18Osw Kojima and Yoshimura, in prep
Cambodian TreeringCellulose δ18O Larger amplitude? Wrong phase?
Comparison with Bristlecone δ18O(preliminary) surface vapor δ18O (‰) precipitation amount (mm/s)
Issues • Relationship between Bristlecone δ18O and δ18O in surface vaporremains unclear. • Limitation of Roden et al. (2000) biochem model? • Did ensemble mean wind field properly work? • A single member run is necessary. • More comparison/verification is needed. 1871-80 Jan 1981-90 Jan Monthly climatology of moisture divergence contribution from transient term
Challenges • Is climate proxy relationship changing? • More accurate and comprehensive climate reconstruction will be achievable. • A climate reanalysis with isotope information? • Simpler model is newly needed. But how? Correlation between temperature and δ18O in precipitation
Thanks for your attention. Any Q&C, send email to keiyoshi08@gmail.com
Model Simulates Individual Storms For the Past 30 Years The most enriched isotopic events are associated with southwesterly flow tapping into a “heavy” vapor pool Berkelhammer et al., prep.
The Current Drought is Different Open Questions: What implications do these ongoing changes have for aridity in the region?
Correlation between spring coral-δ18Osw (March to May) and previous season NINO34 (DJF)
δ18Osw from coral vs. precipitation (1year running average) IsoGSM precipitation Local precipitation (1951~2000)
Simulating sea water isotopes (1979-2009) (Courtesy of Keitaro Kojima) : Model : Obs (Coral) Better reproducibility (R=0.25~0.73) at humid climate sites Seychells (5S 54E) r = 0.41 Philippine (13N 124E) r = 0.54 Δ18Osw(‰) Papua NewGuinea (5S 144E) r=0.73 Vanuatu (16S 167E) r = 0.42 Maiana (2N 173E) r=0.35 Clipperton (10N 108W) r= 0.46
Cambodian Treering Cellulose δ18O Larger amplitude? R=0.324, >99% sig.