Download
1 / 2
20 likes | 170 Views
Supplemental Digital Content 2, Figure 1 Murata et al. Acute lethal crush-injured rats can be successfully rescued by a single injection of high-dose dexamethasone through a pathway involving PI3K-Akt-eNOS signaling

E N D
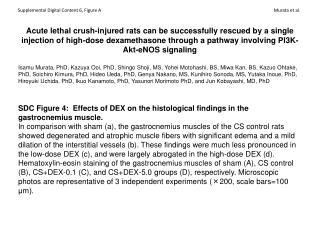
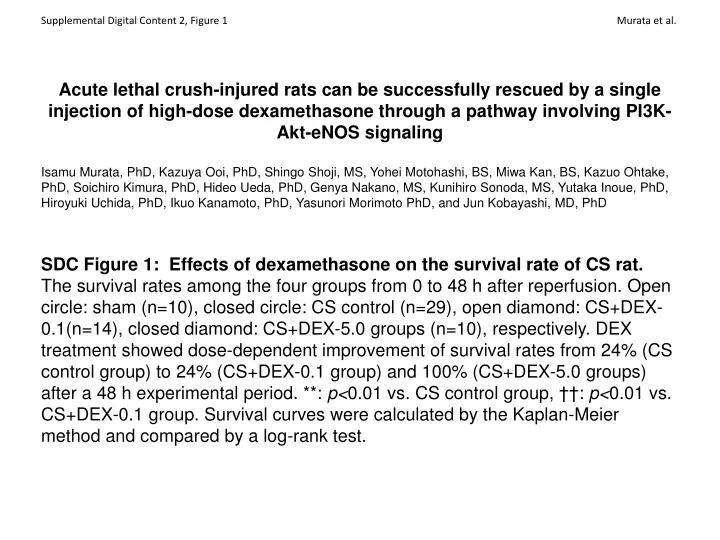
Supplemental Digital Content 2, Figure 1 Murata et al. Acute lethal crush-injured rats can be successfully rescued by a single injection of high-dose dexamethasone through a pathway involving PI3K-Akt-eNOS signaling Isamu Murata, PhD, Kazuya Ooi, PhD, Shingo Shoji, MS, Yohei Motohashi, BS, Miwa Kan, BS, Kazuo Ohtake, PhD, Soichiro Kimura, PhD, Hideo Ueda, PhD, Genya Nakano, MS, Kunihiro Sonoda, MS, Yutaka Inoue, PhD, Hiroyuki Uchida, PhD, Ikuo Kanamoto, PhD, Yasunori Morimoto PhD, and Jun Kobayashi, MD, PhD SDC Figure 1: Effects of dexamethasone on the survival rate of CS rat. The survival rates among the four groups from 0 to 48 h after reperfusion. Open circle: sham (n=10), closed circle: CS control (n=29), open diamond: CS+DEX-0.1(n=14), closed diamond: CS+DEX-5.0 groups (n=10), respectively. DEX treatment showed dose-dependent improvement of survival rates from 24% (CS control group) to 24% (CS+DEX-0.1 group) and 100% (CS+DEX-5.0 groups) after a 48 h experimental period. **: p<0.01 vs. CS control group, ††: p<0.01 vs. CS+DEX-0.1 group. Survival curves were calculated by the Kaplan-Meier method and compared by a log-rank test.
SDC 2, Figure 1 **,†† * Survival rates (%) sham CS control CS+DEX-0.1 CS+DEX-5.0 48 Time after reperfusion (h)