Download
1 / 1
20 likes | 229 Views
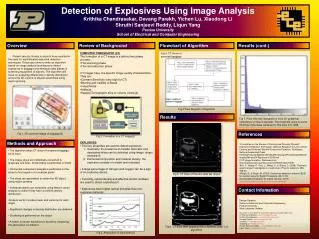
Detection of explosives using image analysis Krithika Chandrasekar, Devang Parekh, Parham Hesamaddin School of Electrical and Computer Engineering, Purdue University, West Lafayette, Indiana. Overview. Review of Background. Flowchart of Algorithm. Results (cont.).

E N D
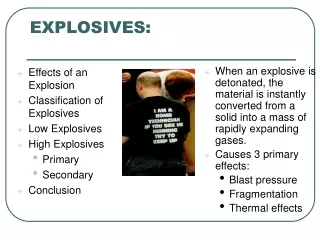
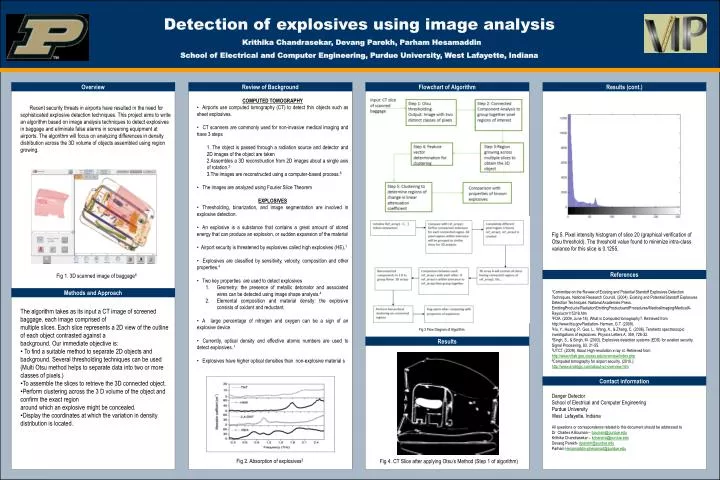
Detection of explosives using image analysis Krithika Chandrasekar, Devang Parekh, Parham Hesamaddin School of Electrical and Computer Engineering, Purdue University, West Lafayette, Indiana Overview Review of Background Flowchart of Algorithm Results (cont.) • Recent security threats in airports have resulted in the need for sophisticated explosive detection techniques. This project aims to write an algorithm based on image analysis techniques to detect explosives in baggage and eliminate false alarms in screening equipment at airports. The algorithm will focus on analyzing differences in density distribution across the 3D volume of objects assembled using region growing. • Fig 1. 3D scanned image of baggage6 • The algorithm takes as its input a CT image of screened baggage, each image comprised of • multiple slices. Each slice represents a 2D view of the outline of each object contrasted against a • background. Our immediate objective is: • To find a suitable method to separate 2D objects and background. Several thresholding techniques can be used (Multi Otsu method helps to separate data into two or more • classes of pixels.) • To assemble the slices to retrieve the 3D connected object. • Perform clustering across the 3 D volume of the object and confirm the exact region • around which an explosive might be concealed. • Display the coordinates at which the variation in density distribution is located. • COMPUTED TOMOGRAPHY • Airports use computed tomography (CT) to detect thin objects such as sheet explosives. • CT scanners are commonly used for non-invasive medical imaging and have 3 steps • 1. The object is passed through a radiation source and detector and 2D images of the object are taken • 2.Assembles a 3D reconstruction from 2D images about a single axis of rotation.2 • 3.The images are reconstructed using a computer-based process.6 • The images are analyzed using Fourier Slice Theorem • EXPLOSIVES • Thresholding, binarization, and image segmentation are involved in explosive detection. • An explosive is a substance that contains a great amount of stored energy that can produce an explosion, or sudden expansion of the material • Airport security is threatened by explosives called high explosives (HE),1 • Explosives are classified by sensitivity, velocity, composition and other properties.4 • Two key properties are used to detect explosives • 1. Geometry: the presence of metallic detonator and associated wires can be detected using image shape analysis.4 • 2. Elemental composition and material density: the explosive consists of oxidant and reductant. • A large percentage of nitrogen and oxygen can be a sign of an explosive device • Currently, optical density and effective atomic numbers are used to detect explosives. 1 • Explosives have higher optical densities than non-explosive material s Fig 5. Pixel intensity histogram of slice 20 (graphical verification of Otsu threshold). The threshold value found to minimize intra-class variance for this slice is 0.1255. References Methods and Approach 1Committee on the Review of Existing and Potential Standoff Explosives Detection Techniques, National Research Council, (2004). Existing and Potential Standoff Explosives Detection Techniques. National Academies Press. EmittingProducts/RadiationEmittingProductsandProcedures/MedicalImaging/MedicalX-Rays/ucm115318.htm 2FDA. (2009, June 18). What is Computed tomography?. Retrieved from http://www.fda.gov/Radiation- Herman, G.T. (2009). 3Hu, Y., Huang, P., Guo, L., Wang, X., & Zhang, C. (2006). Terahertz spectroscopic investigations of explosives. Physics Letters A, 359, 728-32. 4Singh, S., & Singh, M. (2003). Explosives detection systems (EDS) for aviation security. Signal Processing, 83, 31-55. 5UTCT. (2009). About High-resolution x-ray ct. Retrieved from http://www.ctlab.geo.utexas.edu/overview/index.php 6Computed tomography for airport security. (2010.). http://www.analogic.com/about-us-overview.htm Fig 3 Flow Diagram of Algorithm Results Danger Detector School of Electrical and Computer Engineering Purdue University West Lafayette, Indiana All questions or correspondence related to this document should be addressed to Dr Charles A Bouman – bouman@purdue.edu Krithika Chandrasekar – kchandra@purdue.edu Devang Parekh- dparekh@purdue.edu Parham Hesamaddin-phesamad@purdue.edu Contact information Fig 2. Absorption of explosives3 Fig 4. CT Slice after applying Otsu’s Method (Step 1 of algorithm)