1 / 2

FIA Interactive Graphics and Reporting:

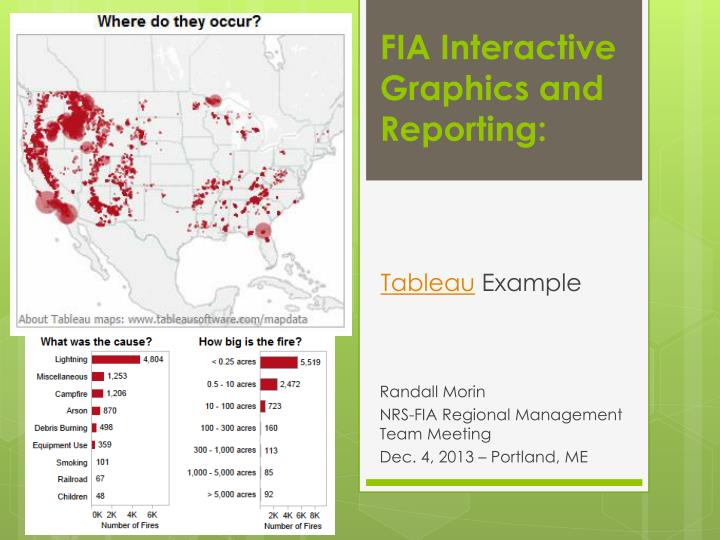
FIA Interactive Graphics and Reporting:. Tableau Example. Randall Morin NRS-FIA Regional Management Team Meeting Dec. 4, 2013 – Portland, ME. Interactive Data. Clickable charts and map to customize data presentation.

farren
Download Presentation

FIA Interactive Graphics and Reporting:

An Image/Link below is provided (as is) to download presentation Download Policy: Content on the Website is provided to you AS IS for your information and personal use and may not be sold / licensed / shared on other websites without getting consent from its author. Content is provided to you AS IS for your information and personal use only. Download presentation by click this link. While downloading, if for some reason you are not able to download a presentation, the publisher may have deleted the file from their server. During download, if you can't get a presentation, the file might be deleted by the publisher.

E N D

Presentation Transcript


  1. FIA Interactive Graphics and Reporting: Tableau Example Randall Morin NRS-FIA Regional Management Team Meeting Dec. 4, 2013 – Portland, ME

  2. Interactive Data Clickable charts and map to customize data presentation

More Related