Download
1 / 26
260 likes | 372 Views
Western Wind Integration Study. May 23, 2007. Agenda. 10:00am - Introductions 10:15 Overview of study - NREL Analysis to be conducted and examples of results from previous studies - GE 11:45 Lunch 12:15pm - Discussion of stakeholder needs - UWIG 2:15 - Data needs - Exeter

E N D
Western Wind Integration Study May 23, 2007
Agenda • 10:00am - Introductions • 10:15 • Overview of study - NREL • Analysis to be conducted and examples of results from previous studies - GE • 11:45 Lunch • 12:15pm - Discussion of stakeholder needs - UWIG • 2:15 - Data needs - Exeter • 2:45 - Next steps - NREL
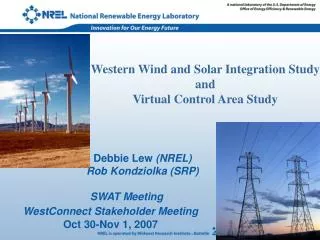
Goal • To support multi-state interests in understanding the operating and cost impacts due to the variability and uncertainty of wind and solar power on the grid • Western Governor’s Clean and Diversified Energy Initiative - 30 GW clean energy by 2015 • President’s Advanced Energy Initiative - wind can supply up to 20% of US electricity consumption
9 6 GW 8 3 13 9 3 3 16 3 6
Issues to investigate • Mitigation measures to manage the incremental variability • Greater diversity of wind resources to reduce variability and increase transmission utilization • Compare local wind resources to better class out-of-state resources (correlation with load, cost) • How hydro can help with wind integration and whether there are limits to the use of hydro for wind integration • The role and value of wind forecasting • Benefits from Balancing Area cooperation or consolidation to manage the variability • Contribution of wind and solar reliability and capacity value
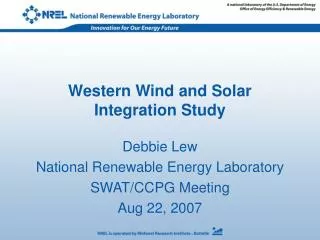
Western Wind Integration Study Loads Rest of WECC Control areas: APS SRP Tucson Electric PNM NV Power Sierra Pacific Wind resources
Key Tasks • Data Collection • Preliminary Analysis • Scenario Development • Run Scenarios • Draft and Final Report
Data Collection • Wind/solar data development • Mesoscale modeling of 10 min wind at 2 km resolution for 3 years (2004-2006?) • Request wind data from utilities and developers to validate mesomodeling and wind development information to help determine wind sites • Rank sites by capacity factor, note distance from transmission • 1-min data for selected periods • Load and generation data by utility • Hourly for three years (2004-06?) • Samples of sub-hourly load (1-min, 10-min) data by utility • Maneuverability and constraints for existing generating resources (MW/minute ramp rates and minimum operating points) • Historical output for existing wind and solar generation facilities • Transmission load flows by control area operator • Obtain from WECC • Load forecast and load forecast error data • Request from utilities
Preliminary Analysis Analysis, including statistical analysis, to help select wind and transmission inputs for scenario design • Group sites into 10-20 wind regions • Statistical analysis with spatial and temporal slices, looking at wind/load variability and correlation • Production value of wind sites - rank by capacity factor • Transmission capability between wind regions • Based on statistical analysis, production value, and transmission capability, develop preliminary costs for each wind region • Based on this analysis, best guess at high renewables scenario (e.g. 30% wind, 5% solar) that is a good balance of resources, existing & new infrastructure, and operability • Develop scenarios to answer specific questions • Meeting to review preliminary analysis and provide input into scenarios
Scenario Description • “Baseline” - 6 control areas have no new renewables • Current levels of renewables in rest of WECC are a ‘best case’ in that there is no extra variability and displacement to account for in the rest of WECC. High levels of renewables in rest of WECC are a ‘worst case’ in that the rest of WECC has to accommodate a high level of variability and displacement before we even consider our 6 control areas. • “High renewables” • We run a high renewables scenario such as 30% wind/5% solar for 2015. If this doesn’t break the system, we move to the variations. If this results in high costs, we change this high renewables case, e.g., by adjusting adjust the non-renewables generation for more flexibility or by reducing the penetration to 20%/3%. • Variations on the “High renewables” case could include • “Diversified” geographic sites • “In-state” renewables • “Mega-projects” with several concentrated project sites • “Best correlated with load” sites • Really need to look at the data to see what makes sense
Data Collection & Mesoscale Modeling June-Nov 2007 Statistical and Preliminary Analysis Dec 2007 - April 2008 Preliminary Results Stakeholder Meeting April 2008 Production Cost Modeling Scenarios and Variations May - October 2008 Draft Report Stakeholder Meeting October 2008 Final Report December 2008
Run Scenarios • For each scenario • Transmission load flow - run PSLF • Run MAPS for all of WECC for hourly variability and imports/exports • Quasi-QSS analysis for intra-hour variability • Expected results • Operating Impacts • Regulation • Load following • Unit Commitment • Evaluate physical performance and limitations of power grid • Transmission Congestion • Reliability metrics such as CPS, ACE, etc. • Evaluate economic/financial performance • Total cost of variable energy production • Changes in emissions (SOx, NOx, CO2) • Impacts of Variable Renewable Generation on the Operations of Hydro generation
Run Scenarios (cont.) • As necessary, evaluate mitigation measures: • Modification of operating procedures • Generation flexibility (existing and new) • Load maneuverability • Wind controls (including curtailment options) • Balancing area consolidation (physical and virtual) • Reserve and ACE sharing • Regional imbalance markets • Storage • Forecasting • “Dives” can be done to examine specific issues such as Hoover resources • Effective Load Carrying Capability and Loss of Load Probability analysis run for 2-3 scenarios (e.g., “in-state”, “diversified”)
Reporting • Draft results and report will be presented at stakeholder meeting • Final report completed by end 2008
Questions to Consider • Overall scope • Study area for loads and renewable resources • Study years (2004-2006?) • Data availability and access • Methodology • Will quasi-QSS analysis suffice? • Flat block comparison? • Need for integration cost by regulation, load following, unit commitment? • Differentiate between costs due to integration versus costs due to loss of market opportunity • Is intra-hour variability borne by load area or resource area? • How important are day-ahead, hour-ahead, real-time markets in this time frame? • Quality of scenarios • Does current levels versus high levels of renewables in rest of WECC capture realistic expectations about exports? • What to assume for system in 2015? • How to benchmark against in-state wind integration studies? • Right levels of wind and solar? Need for the 10, 20, 30% curve? • Answering the right questions?
Questions to Consider (cont.) • Quality of scenarios (cont.) • Right division of geographic concentration vs. geographic diversity? • Some of WY wind needed for WY, and similarly for CO, MT • Transmission • Access to transmission load flows • Appropriate to use crayon transmission? • Do we need to examine transmission stability for high wind loadings? • Operating impacts • Information on hydro and system operations - Hoover • Information on system constraints • Operation constraints • Contractual constraints (if easily available) • Other operating impacts we should try to capture? • Mitigation strategies • How to consider forecasting? • How much to investigate storage? • Other mitigation strategies we should try to evaluate? • Other issues or questions?
Data Collection • Wind/solar data development • Request wind/solar data from utilities and developers to validate mesomodeling and wind/solar development information to help determine sites • Load and generation data by utility • Hourly for three years (2004-06?) • Samples of sub-hourly load (1-min, 10-min) data by utility • Maneuverability and constraints for existing generating resources (MW/minute ramp rates and minimum operating points) • Historical output for existing wind and solar generation facilities • Samples of 1 minute or short timescale output of wind or solar facilities • Transmission load flows by control area operator • Obtain from WECC • Load forecast and load forecast error data • Request from utilities • Regulatory, operational, and contractual constraints • Request from utilities
Comparison of Cost-BasedU.S. Operational Impact Studies * 3-year average; total is non-market cost ** highest integration cost of 3 years; 30.7% capacity penetration corresponding to 25% energy penetration; 24.7% capacity penetration at 20% energy penetration *** found $4.37/MWh reduction in UC cost when wind forecasting is used in UC decision
RPS • Arizona • 15% of electricity sales by 2025 • 4.5% (~2GW) of that is distributed generation, half of which is residential and half for non-residential • Extra credit for early installation of certain technologies and in-state manufactured components • Nevada • 20% of electricity sales by 2015 • 5% of that is solar • New Mexico • IOUs • 15% of retail sales by 2015 and 20% by 2020 • Bio/geo/LFG/FC count as 2x and solar counts as 3x • Coops • 5% by 2015 and 10% by 2020