Download
1 / 37
370 likes | 523 Views
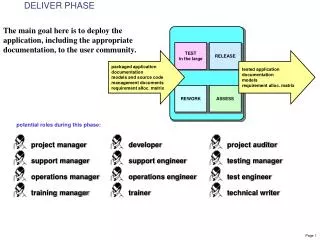
March 12, 2010. How to Deliver Insights that Deliver ROI. 44 th CMAG Meeting. Lenskold Group Overview. Lenskold Group founded in 1997 “Marketing ROI” book named one of the 5 most influential marketing books of 2004 Marketing profitability management ROI Framework Measurement & Analysis

E N D
March 12, 2010 How to Deliver Insights that Deliver ROI 44th CMAG Meeting
Lenskold Group Overview • Lenskold Group founded in 1997 • “Marketing ROI” book named one of the 5 most influential marketing books of 2004 • Marketing profitability management • ROI Framework • Measurement & Analysis • ROI Tools & Dashboards • Workshops & Training • Global 1000 and emerging corporate clients • Workshops conducted in 9 countries with 1,500+ marketers • Leading marketing ROI innovator Partial Client List
Market Intelligence & Research ROI • Why invest in intelligence & research? • Where is the “return” from that investment that delivers and improves ROI? • Should MI be required to generate an ROI? • Insights are critical to guide marketing effectiveness and profitable performance • Insights are applied to improve performance and profitability • Absolutely. Net Profit (Gross Margin – Marketing Invt) ROI = -------------------------- = ------------------------------- Marketing Invt Marketing Investment
Challenges & Opportunities for MI-ROI Challenges • Intelligence and research are delivered to decision-makers who may or may not take action on the insights • Marketing complexity often leads to uncertainly in interpreting insights • Measurement objectives are not well defined by “clients” • Profit drivers critical for ROI are often neglected Opportunities • Identify and present ROI potential with reliable ROI framework • Align insights to a common customer funnel • Guide decision-makers on defining measurement objectives that are strategic and actionable • Use ROI to build and maintain executive support
Goal is Performance & Profitability Customer & Sales Analytics Financial Assessment Marketing Strategy & Position Marketing Performance Σ Profits – Investment ROI = ------------------------------ Marketing Investment Measurements & Metrics Tracking Decision & Mgmt Tools
Budget ROI Profit Contact-to-Impact Provides Strategic Insight Marketing Strategy & Execution • Funnel Progression • Perceptions/Attitudes • Actions/Response • Customer Base/Activity • Transaction Volume • Transaction Size/Mix • Target • Media • Offers • Message • Revenue • Less CGS/Expenses • Less Incremental Expenses Customer Behavior / Response Sales Activity Financial Contribution
Users See Only Two Types of Insights • Marketing ROI is an improvement process, not a pass/fail evaluation GOOD NEWS OR BAD NEWS Intelligence is… • Filtered • Cherry-picked • Sugar-coated
Insights Drive ROI Improvements • What is not working & why • A good marketer will take actions to improve strategies • Customer behavior & influence on key profit drivers • Customer value • Funnel leakage • Impact of non-controllable factors • Competitive and market condition influence • Evaluation or assessment of alternatives • Drive ROI with better marketing effectiveness • Greater success potential to improve, not replace
ROI Management Process ROI Measurement Best Assumptions ROI Scenarios History to guide future campaigns Objectives Strategy Tactical Plan Impact & Contribution Supporting Insights MeasurementPlan Measurements Test Variations in Plan
Quantify ROI Potential & Outcomes Campaign inputs: • Marketing budget • Cost of marketing staff • Assumed impact on sales • Option to detail “funnel” • Sales-driven costs (offers, incentives, discounts, etc.) • Target profile Financial inputs : • Average revenue per sale based on target profile and products • Gross margin % Outputs: • Incremental sales, revenues, and profit • Return on Investment (ROI) Net Profit (Gross Margin – Marketing Invt) ROI = -------------------------- = ------------------------------- Marketing Invt Marketing Investment “Gross Margin” equals the Discounted Cash Flow (Net Present Value) of incremental profits and costs that result specifically from the corresponding marketing investment
Align Insights to Customer Buying Funnel Unaware Prospects Strategies & Tactics 1,000 150 10 2 Brand/Awareness Demand Generation Funnel Progression Sales Conversion Revenue Incremental Sales Impact Customer Experience Profit Contribution & ROI Retention & Cross-Sell Profitable Sales
Wrong Target Not Yet Won Efficiency Effectiveness Understand Funnel Leakage Unaware Prospects 1,000 150 10 2 Profitable Sales Adapted from “The Leaky Funnel” by Hugh Macfarlane (www.leakyfunnel.com)
5. Reduce over-spending beyond progression rate 1. Target High – Value / High – Potential Prospects Initial Prospects 3. Reduce leakage with better integration 4. Accelerate leakage of low- potential prospects 2. Improve conversion later in the funnel Closing sales Customer retention/growth Closed Sales Biggest Wins for ROI Improvement
Framework Provides Perspective for Insights • ROI scenarios show required outcomes • Customer purchase funnel provides a consistent view of diverse insights • Leakage points and leakage reasons can be quantified financially • Diagnostic measures provide deeper insights • Funnel perspective • Segment performance (existing segments or derived from behaviors) • Gaps in marketing and sales alignment • Insight into customer behaviors goes beyond data points • Influence of market conditions provides proper adjustments • Feedback loop from sales to marketing supports better alignment
1. Incremental Contribution • Modeling • Market Testing • Pre-Post Trending • Quantitative Research 1 • 2. Diagnostics • Data Mining • Funnel Analysis • Linkage Analysis • Segmentation Analysis 2 3 Baseline • 3. Predictive (in Long-Term) • Planning Tools • Modeling • Forecasting Measure Marketing Effectiveness
Pre-Post Analysis – Basic Campaign Example • Track value and behaviors prior to marketing treatment to establish baseline for comparison to campaign period results • High risk of outside influence (non-marketing) on sales levels decreases the validity of results analysis
Experimental design “Test” group with marketing treatment compared to control group without treatment Isolates impact of selected treatment Comparisons can go deeper than sales and revenue lift to include customer value and funnel progression to assess lead quality Market Testing – Basic Campaign Example Test Group “Control” Group Tactic 1 Offer 1 Sales Channel Tactic 1 Offer 1 Sales Channel Plus Tactic 2 Different marketing treatment to comparable portion of target audience
Base/Seasonal Advertising Trade Promotion Consumer Promotion Marketing Mix Modeling Modeling correlates marketing activity with sales activity Look for correlations to customer behavior where data is available
Historical 300 250 200 Total Carry-Over Current GRP and Carry-over Effect Index 150 TV Brand 100 TV Promo 50 NP GRP RD GRP 0 Week39 Week40 Week41 Week42 Week43 Week44 Week45 Week46 Week47 Week48 Week49 Week50 Week51 Week1 Week2 Week3 Week4 Week5 Week52 Same Budget 4.5% lift in Sales Optimized 300 250 200 GRP and Carry-over Effect Index 150 Total Carry-Over Revised 100 TV Brand Revised 50 TV Promo Revised 0 NP GRP Revised Week39 Week40 Week41 Week42 Week43 Week44 Week45 Week46 Week47 Week48 Week49 Week50 Week51 Week1 Week2 Week3 Week4 Week5 Week52 Results optimized with broadcast budget held constant Marketing Mix Model Conclusions Courtesy of Interlocking Analytics
Integrated Measurement Plans The best measurement plans are: • Intentional measurements planned in advance • Diverse methodologies integrated for maximum insight • Designed to work together to deepen and build knowledge • Prioritized based on profit opportunity, benefit, and cost • Aligned to the ROI framework for consistent interpretation Measurement Plan (example) The measurement plan must build more and more insight over time 1Qtr 2Qtr 3Qtr 4Qtr Sales Tracking Sales Tracking Sales Tracking Sales Tracking Market Test Segment-Level Analysis Marketing Mix Modeling Customer Value Research
What about Brand? • Does brand awareness count? • Is advertising recall important? • What about the contribution to long term brand? • Where does customer experience research fit in?
Brand & “Intangibles” • Influence customers throughout the buying cycle today • Incremental sales, leads, engagement and/or intentions • Assess incremental contribution • Influence top of the funnel metrics to condition the market for demand generation and sales contacts • Lift in effectiveness of next tactics • Assess integrated campaigns • Invest in re-positioning of key attributes with high influence on purchase decisions • Change in competitive position • Commitment for long-term • Should have lasting impact (brand promise plus brand experience) Perceived Competitive Position
Brand Influence on Sales Perceived Competitive Position Brand Attribute Position Example: Equipment Manufacturer *Durable *High Performance *Inventory Available *Responsive Support *Price-Value *Secure *Quality Resellers * Variety of Models *Active Supporter of Community
Funnel Perspectives Buyers’ Funnel Company Funnel Company view of the funnel shows how measurements align to marketing decisions and implementation effectiveness. This view is used to guide measurement objectives and select methodologies. The buyer’s view of the funnel shows how measurements capture insight into purchase behaviors and leakage points. This view guides the measurement direction to generate insights tied to behaviors that are valuable for developing new strategies. No Need Brand Perceptions Aware Value Prop Product Purchase Intention Interest Consider BRAND Brand Awareness & Consideration Need to Purchase Prefer BRAND Consumer Actions Research Options Prefer BRAND Retail Experience Identify Solution Visit Retailer Purchase Decisions Prefer BRAND Halo Purchases Purchase
Example of Measurement Coverage Buyers’ Funnel No Need Market Testing Ad Tracker Survey Aware Value Prop Interest Web Visitor Intercept Survey Consider BRAND Need to Purchase Prefer BRAND Website Tracking Research Options Store Intercepts Survey Prefer BRAND Identify Solution Visit Retailer Sales Tracking Modeling Sales Associate Research Prefer BRAND Purchase
Managing Marketing Insights • Better objectives for marketing decision-makers • Quantify expected outcomes • Probe on decisions & options for alternatives • Integrate customer funnel into intelligence initiatives • Identify leakage points • Uncover leakage drivers • Present insight into behaviors • Concentrate on high value and high potential segments • Better vs. bigger • Quantify ROI scenarios and run ROI analyses to motivate actions • Profit potential also justifies investment into marketing intelligence
Role of Marketing Intelligence Teams • Marketing ROI process • Based on bringing new insights into strategic and tactical planning • Marketers need clarity in guiding intelligence • Strategic plans with clear path to end goals • Measurement objectives should tie to decisions • Know profit drivers • Align diverse sources of intelligence for consistent and cohesive guidance • Prioritize and integrate measurements • Maximum influence • Strategic and tactical support • Present ROI and profit potential with intelligence • Assess and track the actions taken on insight
CONTACT INFORMATION • Jim Lenskold • Lenskold Group • 2517 Highway 35 • Building N, Suite 202 • Manasquan, NJ 08736 • Phone: 732-223-8886 • E-mail: jlenskold@lenskold.com • Lenskold Group Advantages • Lenskold Group offers an unsurpassed depth of capabilities in marketing ROI processes and measurements. We deliver practical, actionable solutions that truly generate profit improvements. • We are a best fit for companies that: • Require financial integrity to earn credibility outside of marketing • Want decision tools that leverage insight from multiple measurement sources instead of single-methodology solutions • Have a marketing organization committed to profit improvements • Prefer a customized solution over a one-size-fits-all approach • Need a marketer-friendly approach • Value a transition plan designed specifically to their culture and skills • Want analysis and intelligence that can create a clear competitive advantage