Download
1 / 26
260 likes | 362 Views
Speech recognition 1 DAY 14 – Sept 27, 2013. Brain & Language LING 4110-4890-5110-7960 NSCI 4110-4891-6110 Harry Howard Tulane University. Course organization. The syllabus, these slides and my recordings are available at http://www.tulane.edu/~howard/LING4110/ .

E N D
Speech recognition 1DAY 14 – Sept 27, 2013 Brain & Language LING 4110-4890-5110-7960 NSCI 4110-4891-6110 Harry Howard Tulane University
Brain & Language, Harry Howard, Tulane University Course organization • The syllabus, these slides and my recordings are available at http://www.tulane.edu/~howard/LING4110/. • If you want to learn more about EEG and neurolinguistics, you are welcome to participate in my lab. This is also a good way to get started on an honor's thesis. • The grades are posted to Blackboard.
Brain & Language, Harry Howard, Tulane University Review Modularity
Brain & Language, Harry Howard, Tulane University Coltheart’s grouping & my explanation • Specific to a domain • Information is encapsulated • Fixed neural structure • Matures in a specific way • Fails in a specific way • Limits central access • Operates mandatorily • Acts quickly • Analyzes ‘shallowly’ • by definition. • by definition. • in order to keep out all the other stuff. • in order to build the fixed structure. • because it was built in a specific way. • in order to keep out other stuff. • since there is no external access, it can’t be turned on or off. • because there is no other stuff to get in the way of optimizing speed. • because other stuff is necessary to analyze deeply.
Brain & Language, Harry Howard, Tulane University speech recognition Ingram §5
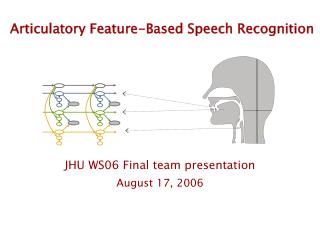
Brain & Language, Harry Howard, Tulane University Three systems involved in speech production Supralaryngeal Laryngeal Respiratory
Brain & Language, Harry Howard, Tulane University Vocal folds and their location in the larynx
Brain & Language, Harry Howard, Tulane University Phonation • Phonation, or speech sound, is created by turbulent oscillation between phases in which the passage of air through the larynx is unconstricted (the expiratory airflow has pushed the vocal folds apart) and phases in which the passage of air is blocked (the vocal folds snap back to their semi-closed position).
Brain & Language, Harry Howard, Tulane University Turbulent oscillation of vocal air • The following figure depicts such a transition, in which increasing darkness symbolizes increasing compression of the airflow. • The heavy line represents the pressure of the airflow through the vocal folds as a single quantity between a minimum and a maximum. • as the vocal folds close, the outflow of air is compressed and its pressure rises; • as they open, the outflow of air is rarefied and its pressure falls. • A single cycle of closing and opening is defined by the distance between two peaks, marked by dotted white lines.
Brain & Language, Harry Howard, Tulane University Graph of turbulent oscillation of vocal air
f o n ə t ɪʃə n Brain & Language, Harry Howard, Tulane University An example: "phonetician"
Brain & Language, Harry Howard, Tulane University Frequency • This cycling of airflow has a certain frequency • the frequency of a phenomenon refers to the number of units that occur during some fixed extent of measurement. • The basic unit of frequency, the hertz (Hz), is defined as one cycle per second.
Brain & Language, Harry Howard, Tulane University Two sine functions with different frequencies • A simple illustration can be found in the next diagram. It consists of the graphs of two sine functions. • The one marked with o’s, like beads on a necklace, completes an entire cycle in 0.628 s, which gives it a frequency of 1.59 Hz. • The other wave, marked with x’s so that it looks like barbed wire, completes two cycles in this period. Thus, its frequency is twice as much, 3.18 Hz.
Brain & Language, Harry Howard, Tulane University Graph of two sine functions with different frequencies
Brain & Language, Harry Howard, Tulane University Fundamental frequency • The pitchof the human voice corresponds to the frequency of vocal fold oscillation, called fundamentalfrequency or F0. • Fundamental frequency & gender • The fundamental frequency of a man’s voice averages 125 Hz; • the fundamental frequency of a woman’s voice averages 200 Hz. • This 60% increase in the pitch of a woman’s voice can be accounted for entirely by the fact that a man's vocal folds are on average 60% longer than a woman’s.
Brain & Language, Harry Howard, Tulane University An example: "phonetician"
Brain & Language, Harry Howard, Tulane University The fundamental & higher frequencies • This brief introduction to the pitch of the human voice leads one to believe that the vocal folds vibrate at a single frequency, that of their fundamental frequency, much as the schematic string on the left side is shown vibrating at its fundamental frequency.
Brain & Language, Harry Howard, Tulane University Higher frequencies • However, this is but a idealization for the sake of simplification of a rather complex subject. • In reality, the vocal folds vibrate at a variety of frequencies that are multiples of the fundamental. • The diagram depicts how this is possible – a string can vibrate at a frequency higher than its fundamental because smaller lengths of the string complete a cycle in a shorter period of time. • In the particular case of the central diagram, each half of the string completes a cycle in half the time.
Brain & Language, Harry Howard, Tulane University Superposition of frequencies • This figure displays the outcome of superimposing both frequencies on the string and the waveform. • The result is that a pulse of vibration created by the vocal folds projects an abundance of different frequencies in whole-number multiples of the fundamental. • If we could hear just this pulse, it would sound, as Loritz (1999:93) says, “more like a quick, dull thud than a ringing bell”.
f o n ə t ɪʃə n Brain & Language, Harry Howard, Tulane University An example: the spectrogram of "phonetician"
Brain & Language, Harry Howard, Tulane University Cavities & resonance • But the human voice does not sound like a quick, dull thud; it sounds, well, it sounds like a human voice. This is because the human vocal tract sits on top of the larynx, and the vocal tract enhances the glottal pulse just like a trumpet enhances the shrill tweet of its reed, as illustrated previously. • In particular, the buccal and nasal cavities resonate at certain frequencies, thereby exaggerating some harmonics while muting others. • The oral cavity itself sits in a channel between two smaller cavities whose size varies according to the position of the tongue and lips. The next diagram zooms in on the buccal cavity to distinguish the other two. Counting from the back, there is • a pharyngeal cavity, • an oral cavity properly speaking, and • a labiodental cavity, between the teeth and the lips. • Notice how the difference in tongue position for [i], the vowel in seed, and [a], the vowel in sod, changes the size of the oral and pharyngeal cavities.
Brain & Language, Harry Howard, Tulane University The three buccal cavities, articulating [i] and [a]
Brain & Language, Harry Howard, Tulane University Formants • This difference produces a marked contrast in the frequencies that resonate in these cavities, as shown by the schematic plots of frequency over time in the next figure. • Such enhanced frequencies, known as formants, carry the acoustic information that allows us to distinguish [i] from [a], as well as most other speech sounds. Roughly speaking, • the resonance of all three cavities together produces the lowest or first formant, • the resonance of the pharyngeal & oral cavities produces the second format, • and the resonance of the labiodental cavity produces the third formant (Loritz 1999:96). • We hedge with “roughly” because the pharyngeal cavity can take on special resonance properties, and the labiodental cavity can combine with the oral cavity; see Ladefoged (1996:123ff) for more detailed discussion.
Brain & Language, Harry Howard, Tulane University Schematic spectrograms of the lowest three resonant frequencies (formants) of [i] and [a]
Brain & Language, Harry Howard, Tulane University What it really looks like
Brain & Language, Harry Howard, Tulane University NEXT TIME Q4 Finish Ingram §5 & start §6. ☞ Go over questions at end of chapter.